Figure 2.

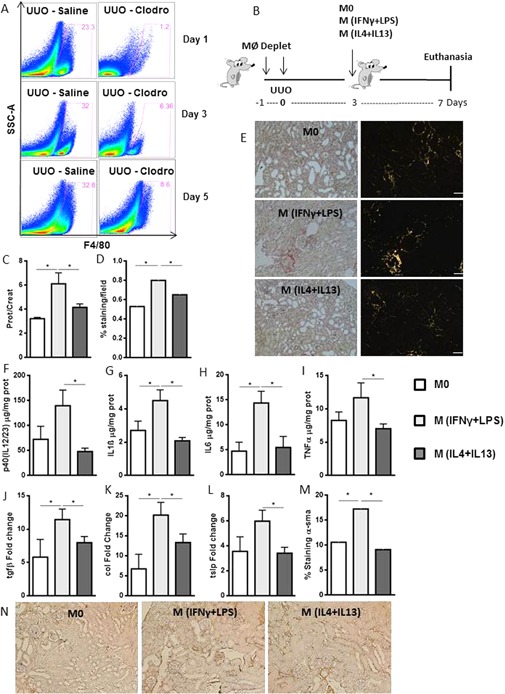
M (IFNγ + LPS) macrophage injection accentuates inflammation and fibrosis compared with M0 and M (IL4 + IL13) injection. A: Time course of macrophage depletion with clodronate‐encapsulated liposomes or saline control. Kidney F4/80+ cells were analyzed by flow cytometry at days 1, 3, and 5 after obstruction. B: Schematic representation of the experimental design. Macrophages of Rag1−/− animals were depleted 1 day before and during ureteral obstruction surgery. A total of 5 × 10⁴ M0, M (IFNγ + LPS), or M (IL4 + IL13) macrophages were injected intravenously on the 3rd day after UUO, and the mice were euthanized on the seventh day. C: Proteinuria in the obstructed pelvises was normalized to that in the urine of the animals before surgery. D and E: Quantification and representative photomicrographs of collagen deposition, as analyzed by Sirius Red staining, in the kidneys of control Rag1−/− macrophage‐depleted animals following injection. Animals were analyzed for (F) p40(IL12/23), (G) IL1β, (H) IL6 and (I) TNFα protein levels using Luminex technology and for (J) tgfβ, (K) type I collagen and (L) tslp mRNA expression levels on day 7 after UUO. M and N: Quantification and representative photomicrographs of α‐sma deposition, as analyzed by immunohistochemistry. In E and N, the bars represent 50 μm in all photomicrographs. Sirius Red staining and α‐sma deposition are represented by the percentage of stained area out of the total area in the field. qPCR data were normalized to HPRT expression, and the mean expression in the Rag1−/− control mice was considered 1. *P < 0.05; and ***P < 0.001. n = 5 animals per group in three different experiments. α‐sma, α‐small muscle actin.
