
Figure 3.
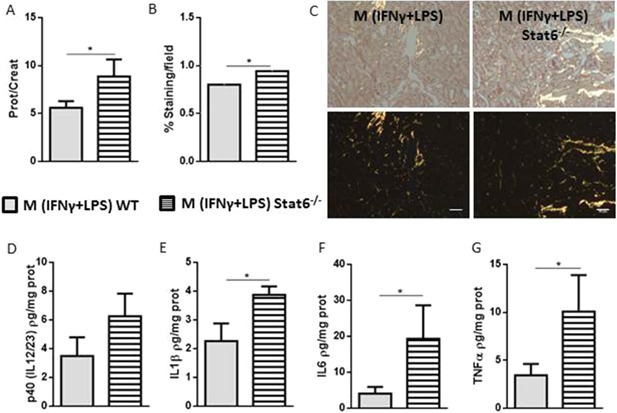
M (IFNγ + LPS) Stat6−/− macrophage injection accentuates obstructive kidney fibrosis compared with M (IFNγ + LPS) Stat6+/+. Rag1−/− animals were depleted of macrophages, and a total of 5 × 10⁴ M (IFNγ + LPS) Stat6+/+ or M (IFNγ + LPS) Stat6−/− macrophages were injected intravenously on the 3rd day after UUO. The mice were euthanized on day 7. A: Proteinuria in the pelvises of the animals undergoing UUO was normalized to that in the urine of the animals before surgery. B and C: Quantification and representative photomicrographs of collagen deposition, as analyzed by Sirius Red staining, in the kidneys of macrophage‐injected animals. Kidney (D) p40 (IL12/23), (E) IL1β, (F) IL6 and (G) TNFα protein levels of the macrophage‐injected animals were analyzed using Luminex technology. In C, the white bars represent 50 μm in all photomicrographs. Sirius Red staining is represented by the percentage of the stained area out of the total area in the field. *P < 0.05; **P < 0.01; and ***P < 0.001. n = 5 animals per group in three different experiments.