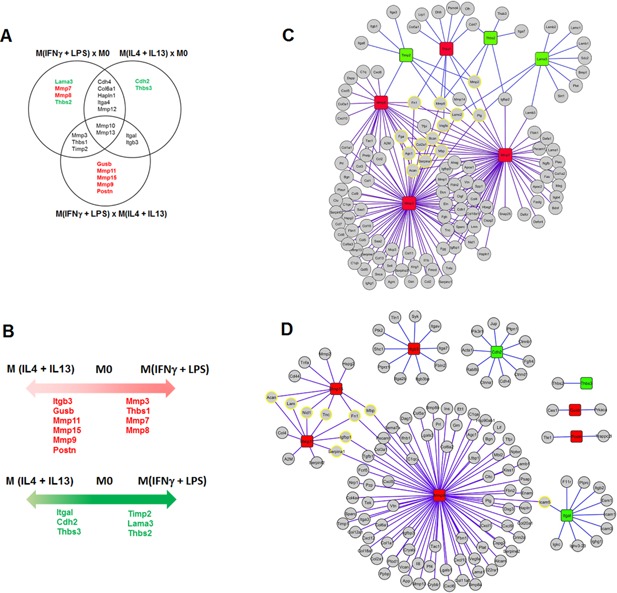
Figure 4.

M (IFNγ + LPS) macrophages have high expression levels of inflammation/fibrosis‐related ECM molecules. PCR array to determine the expression of ECM‐related genes. A: Venn diagram showing gene expression changes identified by comparing the three different macrophage subpopulations. B: Common and unique genes identified in the comparisons in A. C–E: Network analysis of proteolytic pathways related to each macrophage phenotype. The purple lines represent enzyme‐substrate interactions, and the orange lines represent physical interactions. C: Comparisons between M0 and M (IFNγ + LPS) or M (IL4 + IL13) macrophages. The red boxes represent up‐regulated genes, and the green boxes depict down‐regulated genes in M0. D: Comparison between M (IFNγ + LPS) and M0 macrophages. The red boxes represent up‐regulated genes, and the green boxes depict down‐regulated genes in M (IFNγ + LPS). E: Comparison between M (IL4 + IL13) and M0 macrophages. The red boxes represent up‐regulated genes, and the green boxes depict down‐regulated genes in M (IL4 + IL13). All array data are presented as the average gene expression level of ten combined mice per group.
