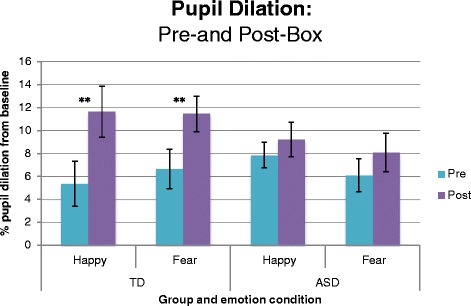
Fig. 4.

Percentage dilation from baseline in each emotion condition for the pre- and post-box. Error bars represent standard error of the mean. **Pairwise comparisons (Bonferroni-corrected) show difference pre- to post-box in the TD group only, for happy (p < .001, η 2 = .45) and fear (p < .001, η 2 = .31). Error bars represent standard error of the mean
