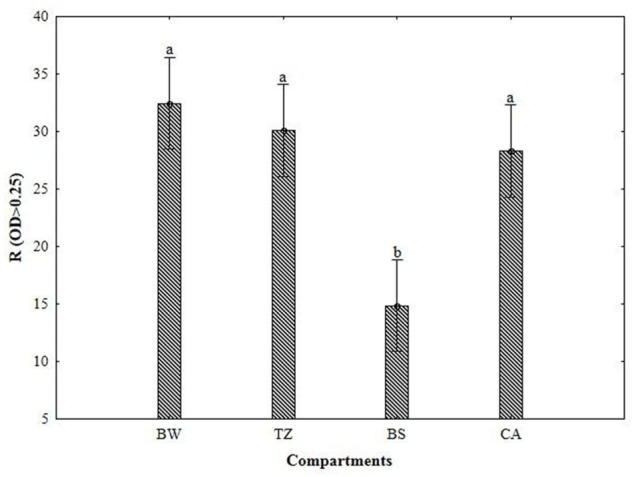
FIGURE 3.

Richness index (R) of metabolized substrates calculated from Biolog data for different compartments of burrow system (BW, burrow wall; TZ, transitional zone; BS, bulk soil; CA, cast aggregates). Error bars represent 0.95 confidence intervals. The different letters indicate significant differences between the compartments at P < 0.05.
