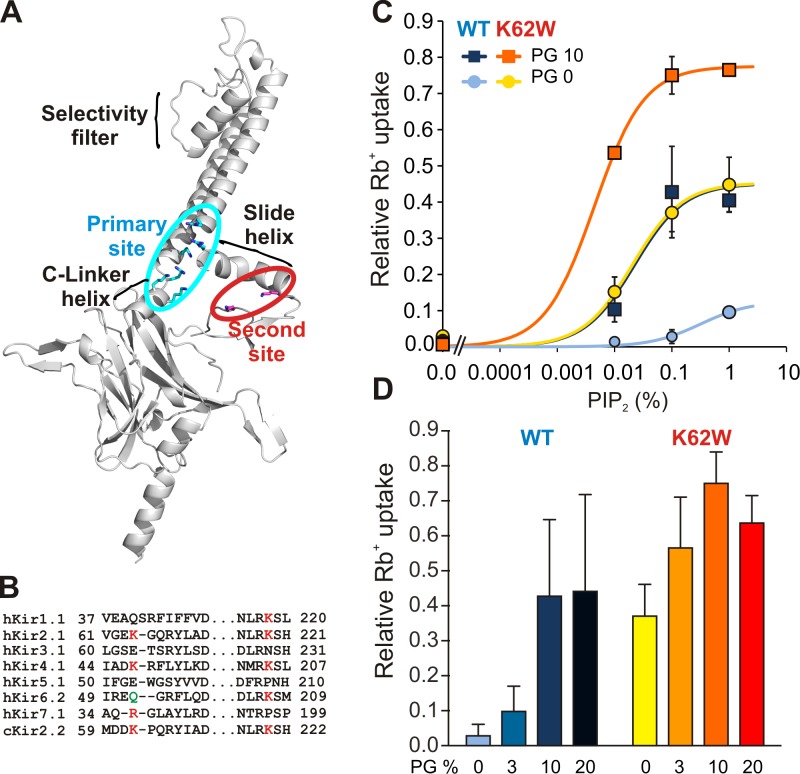
Figure 1.
Increased PIP2 sensitivity but decreased PL− sensitivity in K62W channels. (A) Ribbon diagram of Kir2.2 monomer structure (3SPI). Key functional parts of the protein are labeled, with residues comprising the primary and second sites shown in blue and red sticks, respectively. (B) Sequence alignments of selected regions of Kir subfamily members. Residues important for secondary PL− interaction are shown in red. Q52 of Kir6.2 shown in green causes gain-of-function if mutated to Arg. (C) 86Rb+ uptake versus PIP2 concentration for reconstituted chicken Kir2.2 WT and K62W mutant channels, in the presence of 0 or 10% POPG lipids (mean ± SE, n = 3). The line is the best fit of the one-site binding model in each case. (D) The same experiment was performed at constant 0.1% PIP2, with increasing POPG concentrations as indicated (mean ± SE, n = 3).

