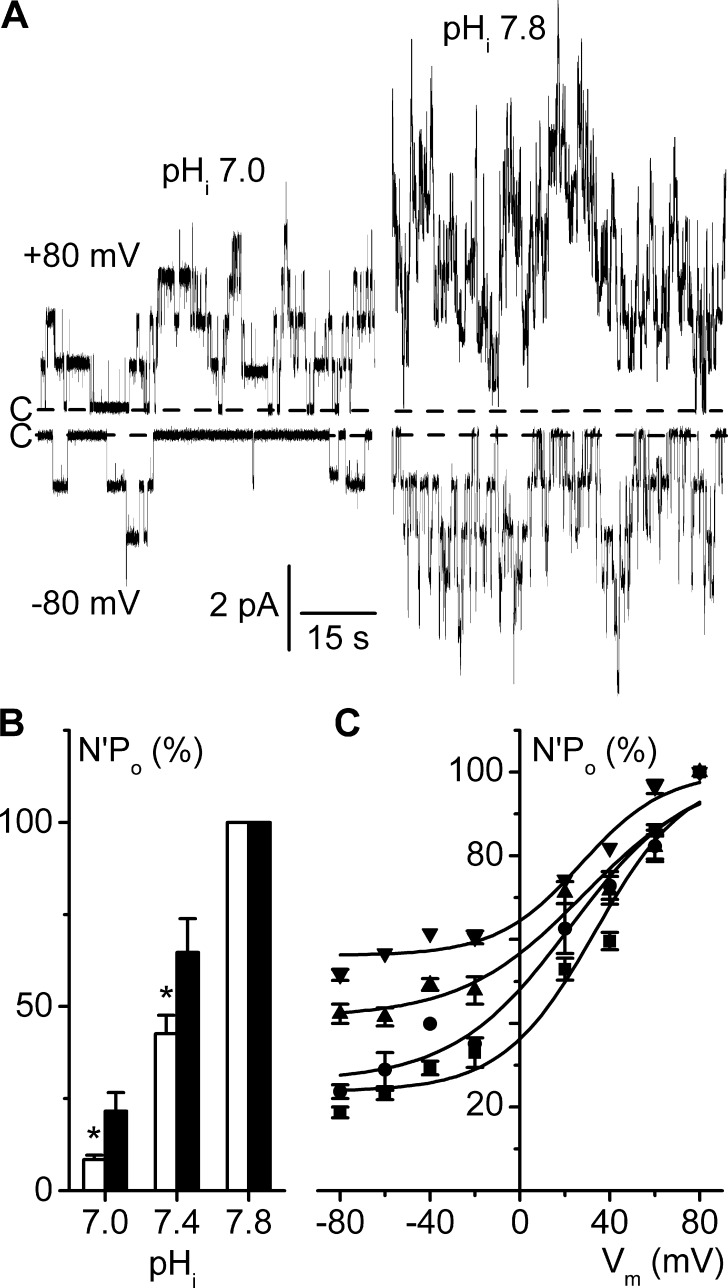
Figure 4.
Increased pHi flattens the voltage dependence curve. Experiments were performed on inside-out patches symmetrically bathed in NMDG-Cl solution. Pipette solution contained 5 mM Ca2+ (pH 7.4), and the bath solution was calcium free. (A) Recordings from the same patch at Vm 80 mV or at Vm −80 mV, at pHi 7.0 or 7.8. Dashed lines indicate the closed channel current levels (C-). (B) Effects of pHi on N′Po in the conditions given in A, at Vm −80 mV (white bars) and at Vm 80 mV (black bars), at the indicated pHi values. At each potential, N′Po values were normalized to their respective values at pHi 7.8; data are given as means of five experiments, and SEM is shown as error bars. *, P < 0.05 versus Vm 80 mV, paired Student’s t test. (C) Mean N′Po/Vm curves at pHi 7.0 (■), 7.4 (●), 7.6 (▲), and 7.8 (▼). For each pHi condition, N′Po data were normalized to the respective N′Po at Vm 80 mV, and each point is the mean of 9–12 (pHi 7.0), 16–19 (pHi 7.4), 6–10 (pHi 7.6), and 8–12 (pHi 7.8) measurements. SEM is shown as error bars when larger than symbols. Continuous lines are the Boltzmann fits of mean data.

