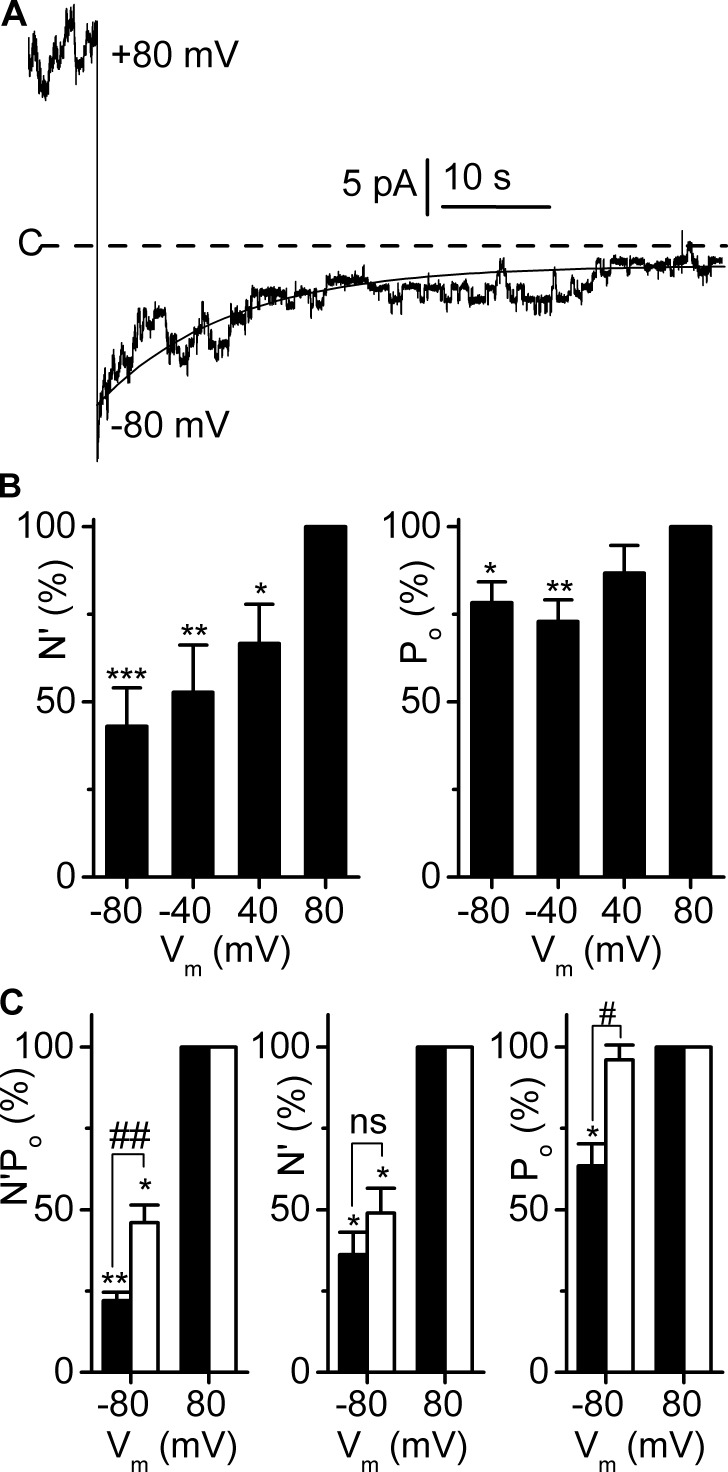
Figure 8.
Membrane voltage modulates the open probability and the number of active channels. Experiments were performed on cell-excised inside-out membrane patches symmetrically bathed in NMDG-Cl solution. Pipette solution contained 5 mM Ca2+ (pHo 7.4), and bath solution was calcium free. (A) Time course of the change in channel activity upon switching Vm from 80 to −80 mV, at pHi 7.4. The dashed line indicates the closed channel current level (C-). The fit of the trace at Vm −80 mV to a single exponential equation (continuous line) indicated an e-fold decrease in channel activity within ∼15 s. (B) Number of active channels per patch (N′) and Po as a function of Vm. For each patch, paired data were normalized to the respective value at Vm 80 mV, pHi 7.4. *, P < 0.05; **, P = 0.01; and ***, P < 0.005, versus Vm 80 mV (Holm-Šidák multiple comparison procedure). (C) Modulation by pHi of the effects of Vm on N′ and Po. For each patch, paired data at pHi 7.4 (black bars) or 7.8 (white bars), at Vm −80 mV, were normalized to the respective value at Vm 80 mV. *, P < 0.005; ** P < 0.0001, versus Vm 80 mV; and #, P < 0.05; ##, P < 0.005 versus pHi 7.8, paired Student’s t test. (B and C) Data are given as means from five patches, and SEM is shown as error bars. N′ was determined by peak current measurements and validated by stationary noise analysis (see Materials and methods). Only recordings yielding ΔN′/N′ values within the 95% agreement interval were taken as valid.

