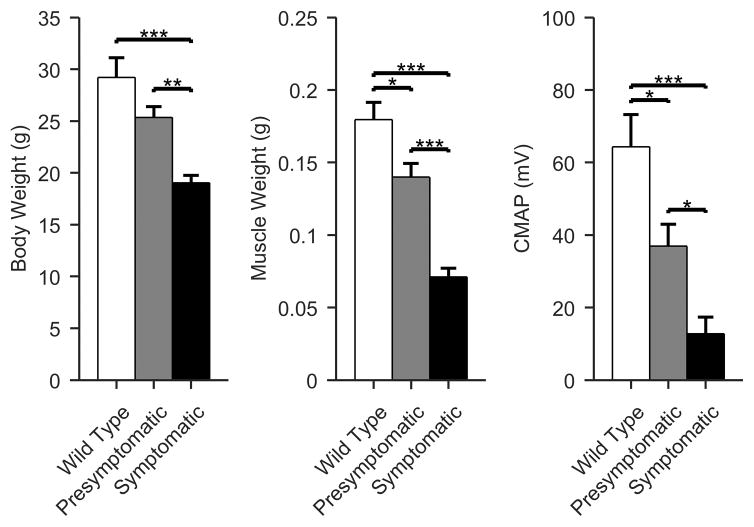
Figure 3.
Single frequency (50 kHz) EIM values. As previously described, the 50 kHz phase values show the greatest differences between all 3 groups of virtually any measure, including body weight, muscle weight, and all force measurements. The reactance also fares fairly well; however, the resistance values are less consistent. See the discussion for potential explanations for these variations. (Mean +/- standard error of mean; White, WT; gray, presymptomatic; black, symptomatic; *p < 0.05, **p < 0.01, ***p <0.001).

