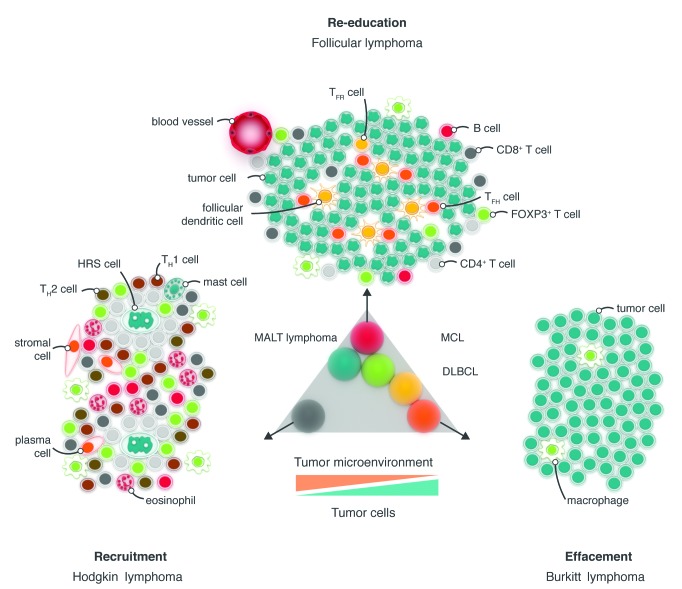
Figure 1.
Schematic diagram of the typical microenvironment of the three B-cell lymphoma subtypes that represent the extremes of the spectrum of tumor microenvironment — recruitment, re-education and effacement. These lymphoma subtypes represent the range of tumor cell content, from ~1% in cHL to typically more than 90% in BL. The other B-cell lymphomas fall within this range, as shown for the most common B-cell lymphomas (center). Typically, the ratio of malignant cells to microenvironmental cells increases across the range, from cHL to BL, as shown. DLBCL, diffuse large B-cell lymphoma; FOXP3, forkhead box protein P3; HRS, Hodgkin Reed–Sternberg; MALT, mucosa-associated lymphoid tissue; MCL, mantle cell lymphoma; TFH, follicular T helper; TH, T helper; TFR, follicular regulatory T. Reproduced from Scott and Gascoyne2 with permission from Nature Publishing Group.

