
Figure 1.
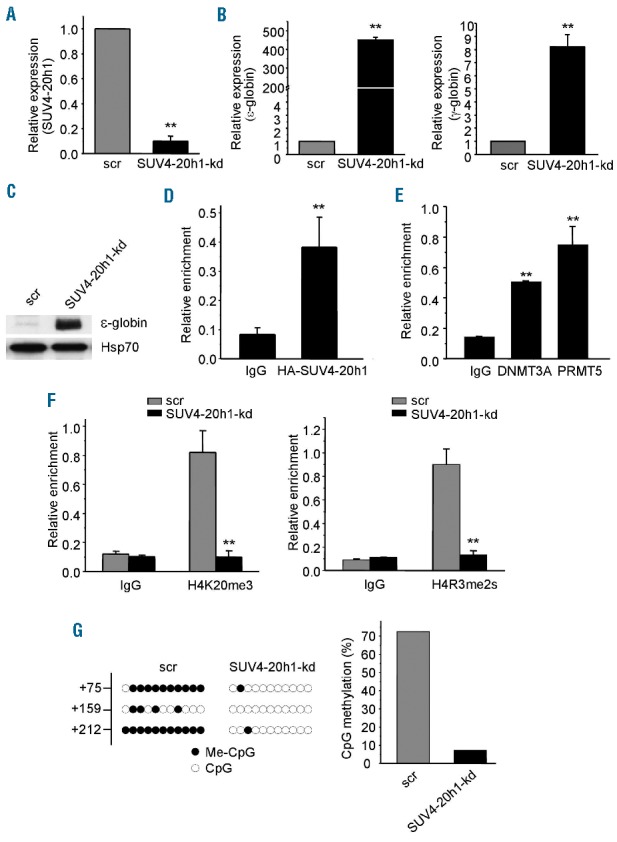
SUV4-20h1 represses ε-globin expression in K562 cells. (A) SUV4-20h1 gene expression analysis by Q-RT-PCR of RNA extracted from SUV4-20h1 knockdown (SUV4-20h1-kd) and scrambled control (scr) K562 cells. Data are normalized to GAPDH mRNA. Results are shown as mean ± SD from three independent experiments; **P<0.01 compared to the scrambled control. (B) ε-globin and γ-globin gene expression analysis by Q-RT-PCR of RNA from SUV4-20h1-kd and scrambled control (scr) K562 cells. Data are normalized to GAPDH mRNA. Results are shown as mean ± SD from three independent experiments; **P<0.01 compared to the scrambled control. (C) Western blot analysis with indicated antibodies of cellular extracts from SUV4-20h1-kd and scrambled (scr) control K562 cells. Hsp70 served as a loading control. (D) ChIP analysis of SUV4-20h1 binding to the ε-globin proximal promoter. HA-tagged SUV4-20h1 detected with anti-HA antibody; mouse IgG served as a control. Results are shown as mean ± SD from three independent experiments; **P<0.01 compared to control. (E) ChIP analysis of DNMT3A and PRMT5 binding to the ε-globin proximal promoter. IgG from mouse served as a control. Results are shown as mean ± SD from three independent experiments; **P<0.01 compared to control. (F) ChIP analysis of histone mark H4K20me3 (left panel) and H4R3me2s (right panel) on the ε-globin promoter of SUV4-20h1-kd cells and scrambled control cells. Results are shown as mean ± SD from three independent experiments; **P<0.01 compared to the scrambled control. (G) DNA methylation at the human ε-gene in SUV4-20h1 knockdown and scrambled control cells. Each line shows the methylation status of individual CpG dinucleotides derived from sequence analysis of 10 representative (of at least 25) individual cloned polymerase chain reaction (PCR) products of the ε-gene after bisulfite modification of the DNA from SUV4-20h1 knockdown and control cells. The differences between the knockdown lines and the scrambled controls are significant (Fisher’s exact test, P<0.0001). The numbers on the left represent the positions of CpG dinucleotides relative to the transcriptional start site of the ε-gene. The results are quantitated in the bar chart (right panel).