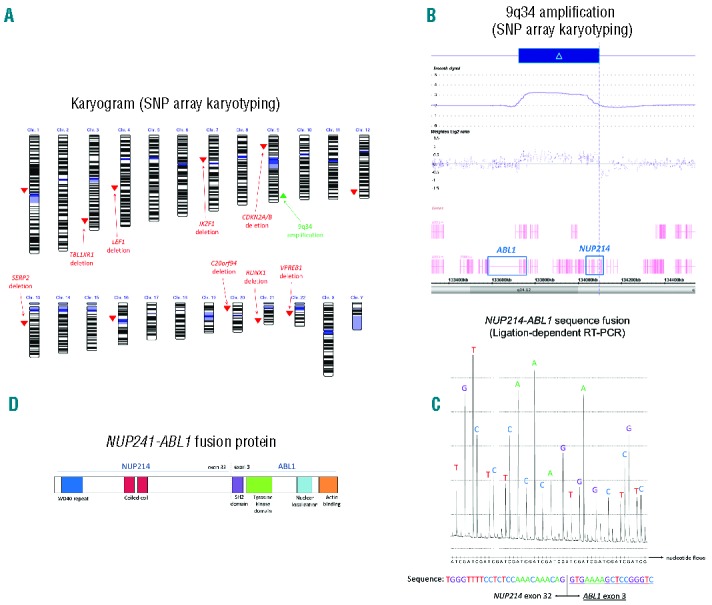
Figure 1.

(A) Results of SNP array karyotyping. Genetic losses are shown in the color red. Amplification is show in green. (B) 9q34 amplification delimited by NUP214 and ABL1 (picture from Chromosome Analysis suite®). CN =copy number. (C) NUP214-ABL1 fusion sequence determined by ligation-dependent RT-PCR. (D) Schematic representation of the NUP214-ABL1 fusion protein.
