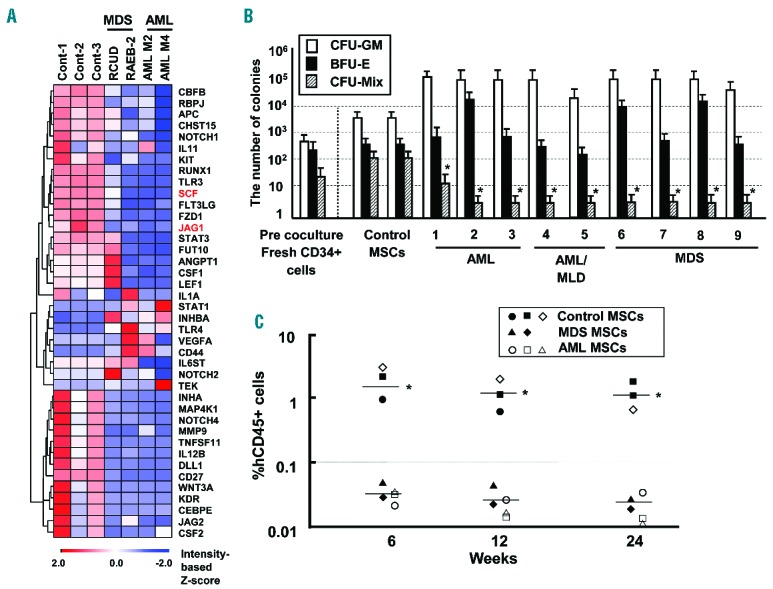
Figure 1.

Comparative analysis of mRNA expression between HV- and AML/MDS-derived MSCs. (A) Analysis of hematopoietic factors in MSCs by qRT-PCR array. Results of cluster analysis in MSCs-derived from control (MSC ID 10, 11 and 12), RCUD (MSC ID 8), RAEB-2 (MSC ID 6), AML M2 (MSC ID 2) and AML M4 (MSC ID 1) patients (Online Supplementary Table S1). (B) Clonogenic assay after coculture with human stromal cells. Y-axis indicates the number of colonies after ex vivo coculture of 2×10⁴ BM CD34+cells on MSC layer. X-axis indicates the individual MSCs derived from control and AML/MDS patients. Pre-coculture indicates the number of colonies derived from fresh BM CD34+ cells. MSCs derived from HV were used as normal control. *P<0.01, colony-forming units (CFU)-Mix: primary AML/MDS-derived MSCs vs. normal control-derived MSCs (Student’s t-test, two-tailed). BFU-E, burst forming units of erythroid; CFU-GM, CFU-granulocyte/monocyte; CFU-Mix, CFU-mixed. Results are expressed as means ± SD. Similar results were obtained in 3 independent experiments, performed in triplicate. AML/MLD: AML with multi-lineage dysplasia. (C) All hematopoietic cells that were cocultured with AML/MDS-derived MSCs were transplanted into immunodeficient mice. Representative results, each performed in triplicate of control MSCs (ID 10 (●), ID 11 (■), ID 12 (□)), MSCs derived from AML (ID 1 (○), ID 3 (□), ID 4 (△)) and MSCs derived from MDS (ID 9 (▲), ID 8 ()), are shown (Online Supplementary Table S1). Y-axis indicates the percentage of human specific CD45+ cells. X-axis indicates weeks after transplantation. *P<0.01 controls vs. AML/MDS. Similar results were obtained in two independent experiments.
