
Figure 4.
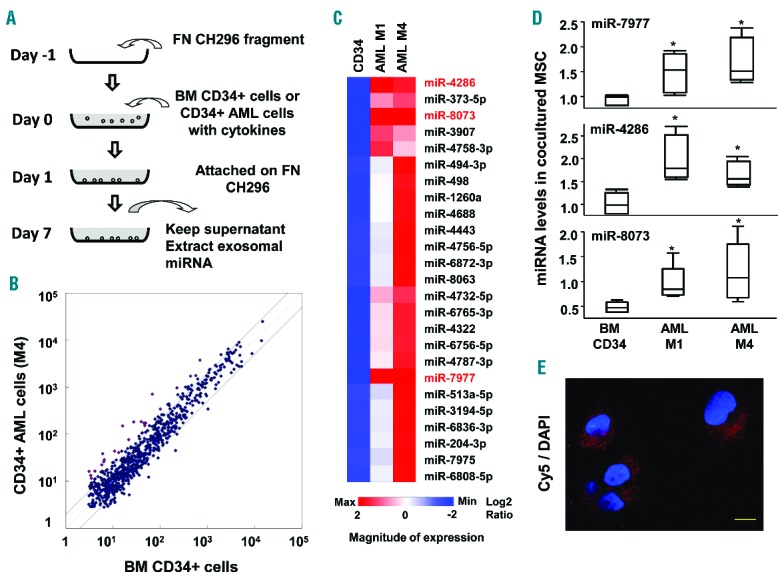
Comparison of miRNA between primary hematopoietic and leukemic CD34+ cells. (A) The culture system using normal BM or AML CD34+ cells plated on fibronectin substratum in the presence of cytokines including SCF, TPO, FLT3LG, IL-3 and DLL4. In this system, fibronectin fragment instead of MSCs was utilized to purify the EVs derived from hematopoietic cells. (B) miRNA was analyzed by miRNA chip and compared. Scattered plot demonstrates that EV miRNA is released from normal CD34+ and primary AML cells (M4, Sample ID 40). (C) Heatmap of elevated EV miRNAs derived from leukemic CD34+ cells as compared with those from normal CD34+ cells. Highlighted EV miRNAs show more than 2-fold elevation in both AML M1 (Sample ID 35) and AML M4 (Sample ID 40) as compared with normal CD34+ cells (Online Supplementary Table S2). CD34: commercially purchased normal CD34+ cells. (D) The levels of miR-7977, miR-4286 and miR-8073 were examined by qRT-PCR in MSCs cocultured with BM CD34+, primary AML M1 and AML M4 cells. SNORD61 was used as an internal standard. Results are expressed as means ± SD. *P<0.05, normal MSCs cocultured with AML cells vs. normal MSCs cocultured with CD34+ cells (Student’s t-test). (E) Cy5-labeled miR-7977 was transfected into AML M1 cells, which were cocultured with MSCs for 3 days. The labeled miR-7977 that was transferred into MSCs was analyzed by super resolution confocal microscopy (ZEISS/ELYRAS 1LSM780). Scale bar: 10 μm.