
Figure 7.
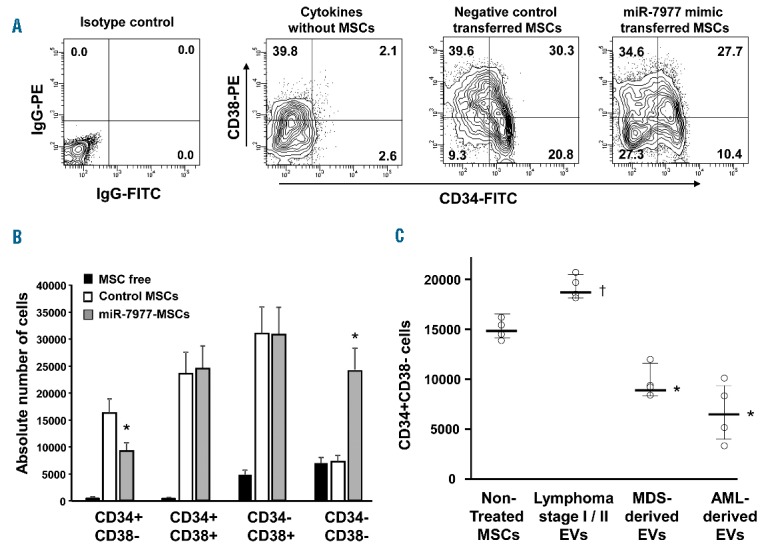
Hematopoietic-supporting capacity of miR-7977 mimic-transfected MSCs. (A) Expression of CD34 and CD38 in ex vivo cocultured hematopoietic cells. The X-axis indicates CD34 labeled with a FITC-conjugated monoclonal antibody (CD34-FITC). The Y-axis indicates CD38 labeled with a PE-conjugated monoclonal antibody (CD38-PE). Positivity for a surface antigen was defined using the isotype control monoclonal antibody. Left panel: Isotype control. Middle left panel: Expression of CD34/CD38 in ex vivo cultured hematopoietic cells without MSCs in the presence of SCF, TPO, FLT3LG and DLL4. Middle right panel: Expression of CD34/CD38 in cocultured hematopoietic cells with negative control-transfected MSCs. Right panel: Expression of CD34/CD38 in cocultured hematopoietic cells with miR-7977 mimic-transfected MSCs. Data shown are from one representative experiment of three showing similar results. (B) The summary of CD34/CD38 positive cells after culture with or without MSCs. *P<0.01 negative control vs. miR-7977 mimic. MSC free: CD34/CD38 positive cells among cultured hematopoietic cells without MSCs. (C) Expression of CD34 in ex vivo hematopoietic cells cocultured with HV-derived MSCs harboring EVs derived from lymphoma stage I/II (control), MDS or AML patients. Non-treated HV-derived MSCs (n=4, lot number #3), MSCs with control EVs (n=4, sample ID 1, 2, 3 and 4), MSCs with MDS-derived EVs (n=4, sample ID 10, 11, 22 and 23) and MSCs with AML-derived EVs (n=4, sample ID 28, 29, 31 and 33). MDS- and AML-derived EVs contained abundant miR-7977. The Y-axis indicates absolute number of CD34+CD38− cells. *P<0.01, Non-treated MSCs vs. MSCs with AML/MDS-derived EVs. †P<0.05, Non-treated MSCs vs. MSCs with HV-derived EVs (Student’s t-test, two-tailed). Data shown are from one representative experiment of three showing similar results.