
Figure 2.
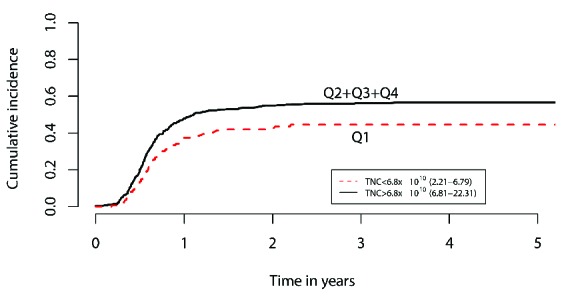
Regression analyses of TNC dose. Dichotomized regression analysis of the top three quartiles (collapsed) vs. quartile one, showing increased cumulative risk of chronic GVHD at 1 year with higher TNC dose (HR=0.71, P=0.0063).
Official websites use .gov
A
.gov website belongs to an official
government organization in the United States.
Secure .gov websites use HTTPS
A lock (
) or https:// means you've safely
connected to the .gov website. Share sensitive
information only on official, secure websites.
Regression analyses of TNC dose. Dichotomized regression analysis of the top three quartiles (collapsed) vs. quartile one, showing increased cumulative risk of chronic GVHD at 1 year with higher TNC dose (HR=0.71, P=0.0063).