
Figure 4.
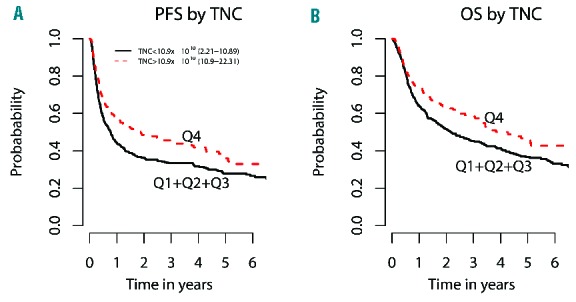
Dichotomized regression analyses of TNC dose. (A) Dichotomized regression analysis of first three quartiles (collapsed) vs. quartile four, showing improved 3-year progression-free survival (PFS) with higher TNC dose (HR=0.68, P=0.00067). (B) Dichotomized regression analysis of first three quartiles (collapsed) vs. quartile four, showing improved 3-year overall survival (OS) with higher TNC dose (HR=0.69, P=0.0028).