
Figure 1.
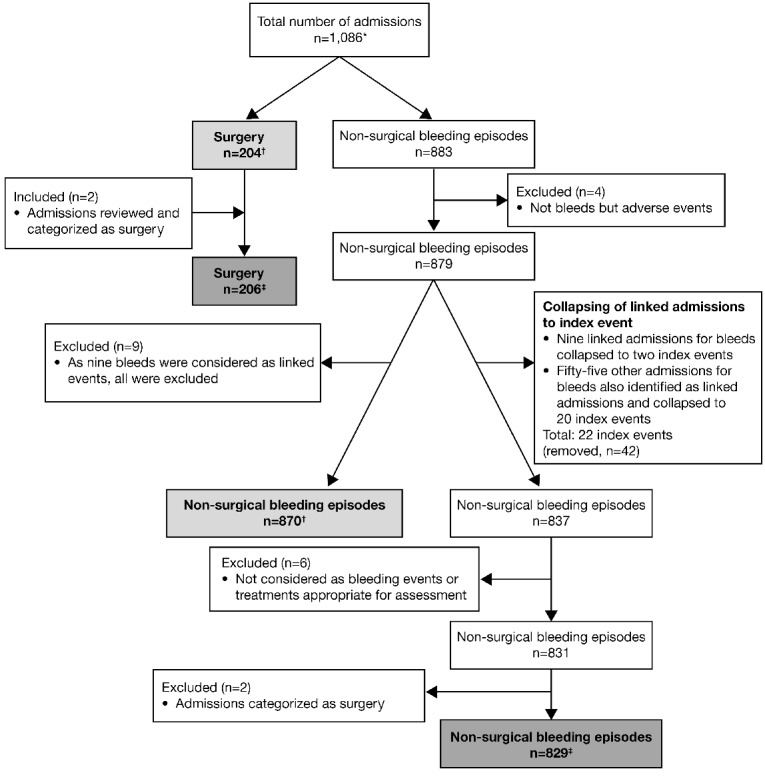
Chart depicting the flow of admissions into the GTR and the data used for primary and secondary analyses. *One admission was considered both a surgical procedure and a bleeding episode. †Data used for the primary effectiveness analysis (performed in 2012). ‡Data used for the secondary data analysis (performed in 2014). All data were included in the safety analysis.