Figure 1.
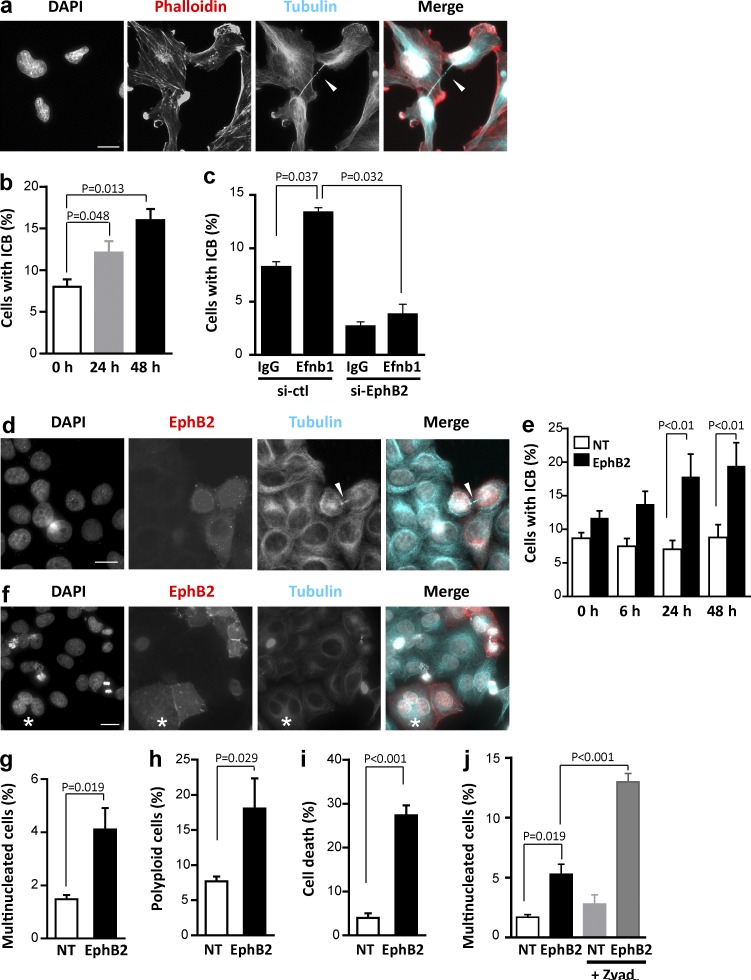
EphB2 forward signaling induces persistence of the ICB and multinucleation. (a) U251 cells were stimulated with Efnb1-Fc for 24 h and processed for DNA staining (gray, DAPI), actin staining (red, phalloidin), and immunostaining to detect β-tubulin (blue). Arrowhead indicates an ICB between daughter cells. (b) Quantification of the proportion of nascent daughter cells connected by an ICB after Efnb1-Fc stimulation for the indicated times. (c) U251 cells were transfected with control siRNAs or siRNAs targeting EphB2 and mock stimulated or stimulated with Efnb1-Fc. The proportion of U251 cells connected by an ICB was quantified as described in Methods. (d) HeLa cells transiently transfected with EphB2 and stimulated with Efnb1-Fc for 24 h were processed for DNA staining (gray, DAPI) and immunostained to detect EphB2 (red) and β-tubulin (blue). Arrowhead indicates an ICB between EphB2+ daughter cells. (e) Quantification of the proportion of NT (white bars) and EphB2-transfected (EphB2, black bars) cells connected by an ICB after Efnb1-Fc stimulation for the indicated time. (f) HeLa cells transiently transfected with EphB2 and stimulated with Efnb1-Fc for 24 h were stained as in d. Asterisk indicates a multinucleated cell. (g) Proportion of multinucleated cells in NT (white bars) and EphB2-transfected (EphB2, black bars) populations. (h and i) NT and EphB2-transfected (EphB2) HeLa cells were stimulated with Efnb1-Fc for 24 h and fixed, and DNA was stained using propidium iodide. DNA content of EphB2− (white bars) and EphB2+ (black bars) cells was analyzed by flow cytometry to quantify the proportion of polyploid cells (>4N DNA content; h) and dead cells (sub-G1 DNA content; i). (j) NT and EphB2-transfected (EphB2) HeLa cells were untreated or treated with Zvad and stimulated with Efnb1-Fc for 24 h, and the fraction of multinucleated cells was quantified. Error bars correspond to SEM. Statistical p-value is indicated when significant. Bars, 10 µm.

