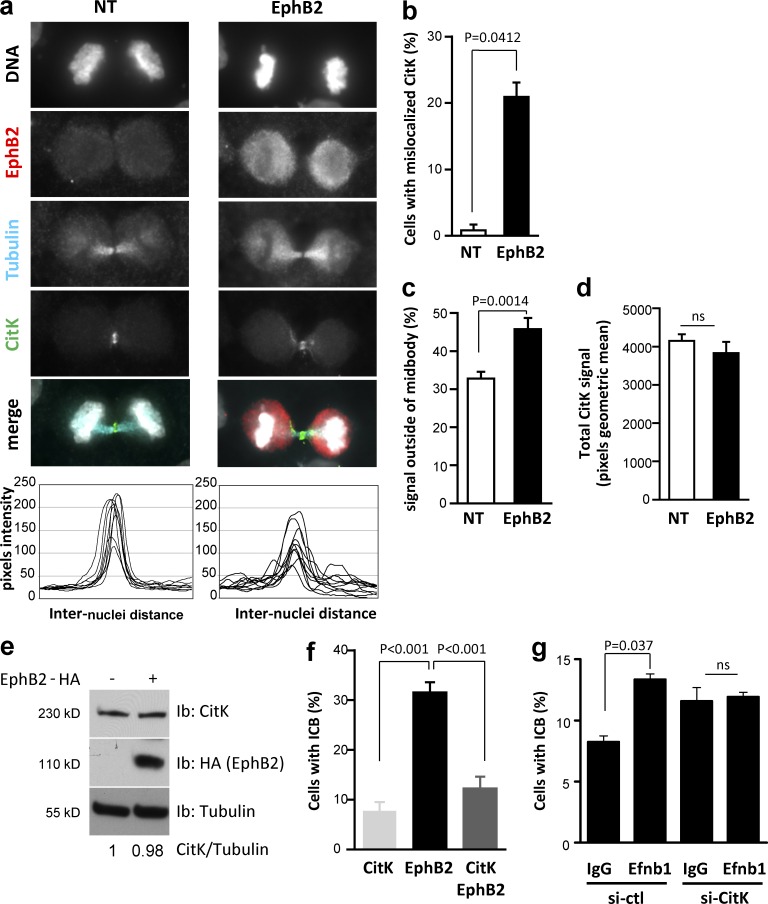
Figure 3.
Functional interaction between EphB2 and CitK in abscission. (a) HeLa cells untransfected (NT) or transfected with EphB2 and stimulated with Efnb1-Fc were stained for DNA (gray, DAPI) and immunostained to detect EphB2 (red), β-tubulin (blue), and CitK (green). The bottom panels represent the distribution of the CitK signal in the ICB for n = 10 cells for each condition. (b) Proportion of stimulated NT (n = 79) and EphB2-transfected (n = 59) cells in telophase with abnormal distribution of CitK in the ICB. (c) Proportion of CitK signal outside of the midbody in stimulated NT (n = 10) and EphB2-transfected (n = 10) cells. (d) Quantification of total CitK signal in stimulated NT (n = 10) and EphB2-transfected (n = 10) cells. (e) Protein lysates from HeLa cells untransfected (−) or transfected with HA-tagged EphB2 (+) and stimulated with Efnb1-Fc were immunoblotted to detect EphB2-HA, endogenous CitK, and tubulin. (f) HeLa cells were transiently transfected with CitK FL, EphB2, or EphB2+CitK and stimulated with Efnb1-Fc for 24 h. The proportion of daughter cells connected by an ICB was quantified in each condition. (g) U251 cells were transfected with control siRNAs or siRNAs targeting CitK and mock stimulated or stimulated with Efnb1-Fc. The proportion of U251 cells connected by an ICB was quantified. These experiments were performed at the same time as the experiments presented in Fig. 1 c; thus the controls (si-ctl) are the same. Error bars correspond to SEM. Statistical p-value is indicated when significant. ns, nonsignificant. Bars, 10 µm.

