Figure 5.
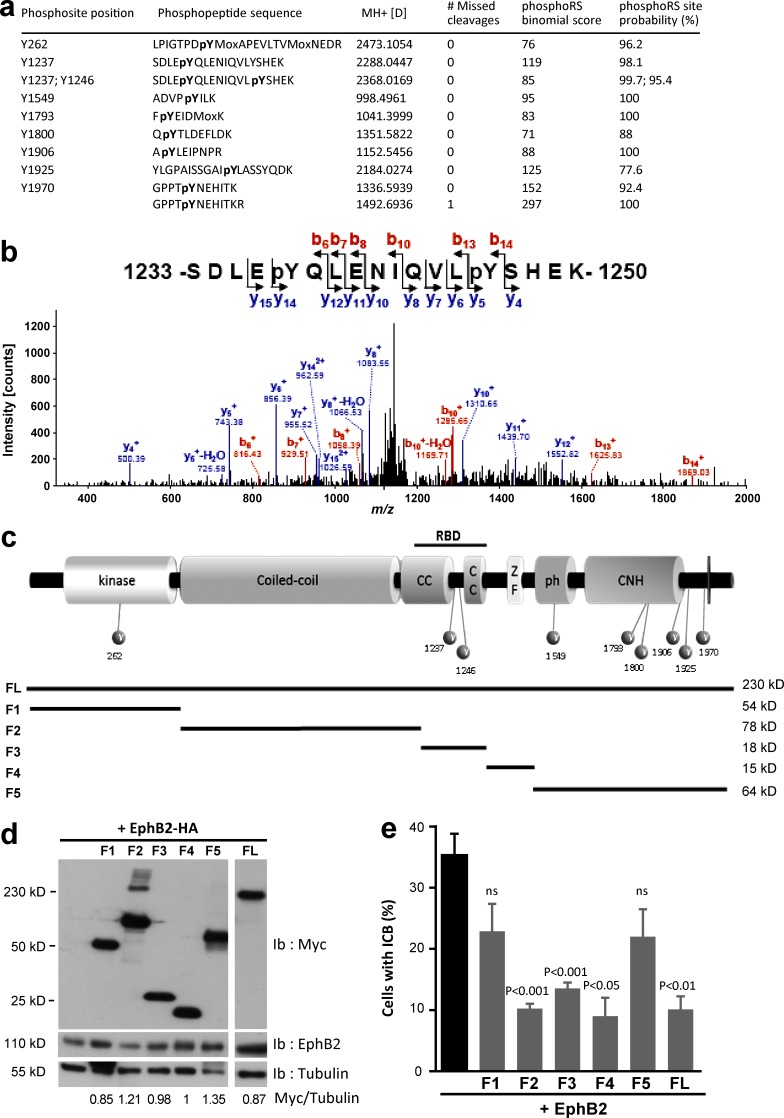
Identification of phosphorylated tyrosines on CitK. (a) Tyrosine-phosphorylated peptides identified on CitK by nanoLC-MS/MS. (b) The CID MS/MS spectrum of the diphosphorylated peptide, 1233-SDLEpYQLENIQVLpYSHEK-1250 (doubly charged precursor ion, MH2+, at m/z 2 1184.5121) displays a series of y- and b-ions, indicating that Y1237 and Y1246 are phosphorylated. pY, phosphorylated tyrosine residues. (c) Schematic drawing illustrating the distribution of Src-phosphorylated tyrosines identified by nanoLC-MS/MS analysis on CitK and the F1–F5 fragments of CitK. (d) HEK-293 cells were cotransfected with HA-tagged EphB2 and full-length myc-tagged CitK (FL) or the indicated myc-tagged CitK fragments (F1 to F5). Protein lysates were immunoblotted for Myc and EphB2. Tubulin was used as loading control (the upper band in the F1 sample corresponds to leftover signal from the Myc immunoblot). Ratio of signal intensity is provided below. (e) HeLa cells were transfected with EphB2 alone or with CitK FL or the indicated CitK fragments (F1 to F5). Cells were stimulated with Efnb1-Fc, and the proportion of cells connected by an ICB at 24 h of treatment was quantified in each condition. Statistical significance was calculated by comparison to the EphB2-alone condition (black bar). Error bars correspond to SEM. Statistical p-value is indicated when significant. ns, nonsignificant.

