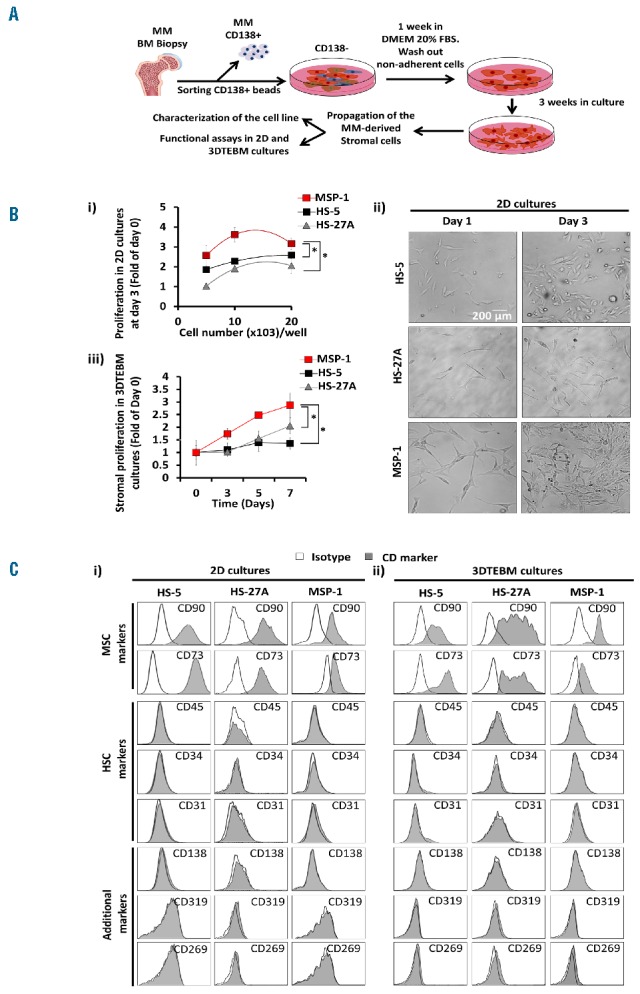
Figure 1.

Establishment and characterization of myeloma-derived stromal cell line in 2D and 3DTEBM cultures. (A) Design of strategy for establishment of myeloma-derived stromal cell line. Primary CD138- cells were isolated from BM aspirate of MM patient 1 (female, had 9% plasma cells with progressive disease; gene expression analysis: Trisomy 1q21, Monosomy 13, 13q Deletion; treatment history prior to banking: Thalidomide, Revlimid, Dexamethasone, Ibrutinib, ASCT, and Velcade) from the Siteman Cancer Center, Washington University in Saint Louis, by CD138-magnetic-bead sorting and bone marrow aspirates were subjected to Ficoll-Paque gradient centrifugation. Informed consent was obtained from all patients with an approval from the Washington University Medical School IRB committee and in accord with the Declaration of Helsinki. Primary CD138- cells were cultured in DMEM supplemented with 20% fetal bovine serum, non-adherent cells were washed out, then stromal cells were maintained on DMEM culture for 3 weeks and monitored for the development of spindle-shaped cells. Establish myeloma-derived stromal cell line named Myeloma Stromal Puente-1 (MSP-1) was initially characterized and then frozen. Cultures were tested for mycoplasma and the results were negative, and the name of the cell line was checked against the International Cell Line Authentication Committee (ICLAC). B) Effect of stromal cell density (HS-5, HS-27A and MSP-1) (5 × 10³ – 20 × 103 cells/well) on i) proliferation in 2D cultures by flow cytometry analysis, ii) representative images of 2D cultures at day 1 and 3; effect of time of culture on stromal (HS-5, Hs-27A and MSP-1), and iii) proliferation in 3DTEBM cultures measured by flow cytometry analysis. Scale bar= 200 μm, (*) P< 0.05. Morphological observations of cells in 2D were performed with an inverted microscope (Zeiss Axiovert 35 and camera Canon EOS rebel T3). C) Flow cytometry representative histogram of expression of mesenchymal stromal markers (MSC) markers (CD90, CD73), hematopoietic stem cell markers (HSC) (CD45, CD34), MM markers (CD138, CD269/BCMA, CD319/SLAMF7) and endothelial markers (CD31) (grey) and respective isotype controls (white) in stromal cells maintained in i) 2D cultures and ii) 3DTEBM cultures. Experiments were performed in triplicates (Figure 1Bii, Figure 1C) or quintuplicates (Figure 1Bi, Figure 1Biii) and each experiment was repeated 3 times. Results are shown as mean ± standard deviation and analyzed using two-way ANOVA for statistical significance, and were considered significantly different for P value less than 0.05.
