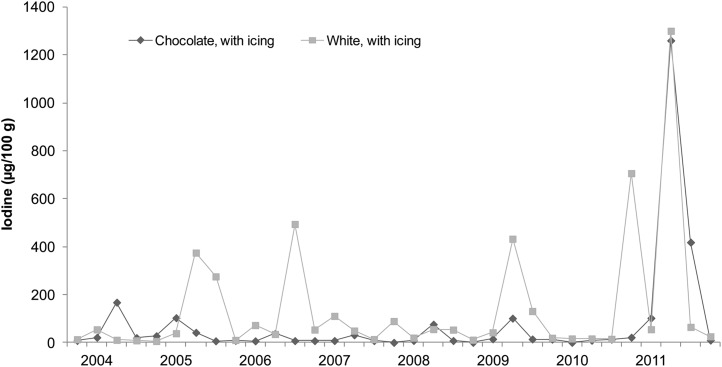
FIGURE 1.
Iodine concentrations in cakes: US Food and Drug Administration’s Total Diet Study, third quarter 2003–fourth quarter 2011. Each data point represents the iodine concentration in a single quarterly sample; each quarterly sample is a composite of subsamples from 3 cities (26).

