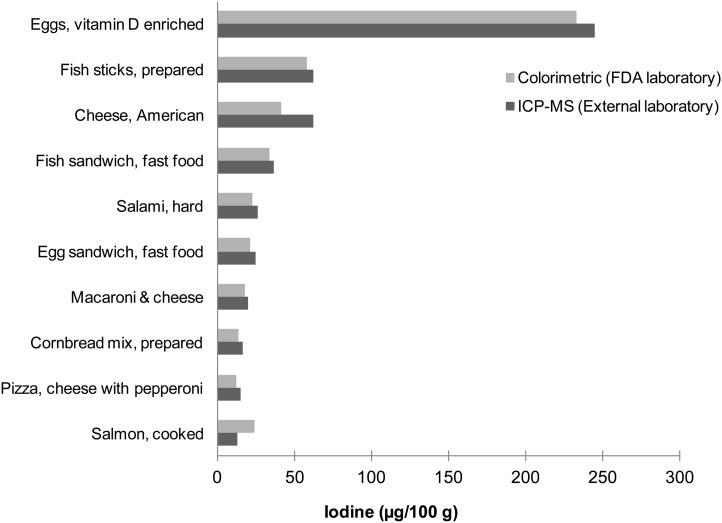
FIGURE 5.
Comparison of iodine analysis by ICP-MS (29) and a colorimetric method (24) in 10 foods. A single sample of each food (n = 1) was analyzed by both methods. The ICP-MS analysis was conducted by a commercial laboratory prequalified by the USDA’s Nutrient Data Laboratory. The colorimetric analysis was conducted by the FDA. Foods are displayed in order of their iodine content as measured by the ICP-MS method. FDA, Food and Drug Administration; ICP-MS, inductively coupled plasma mass spectrometry.

