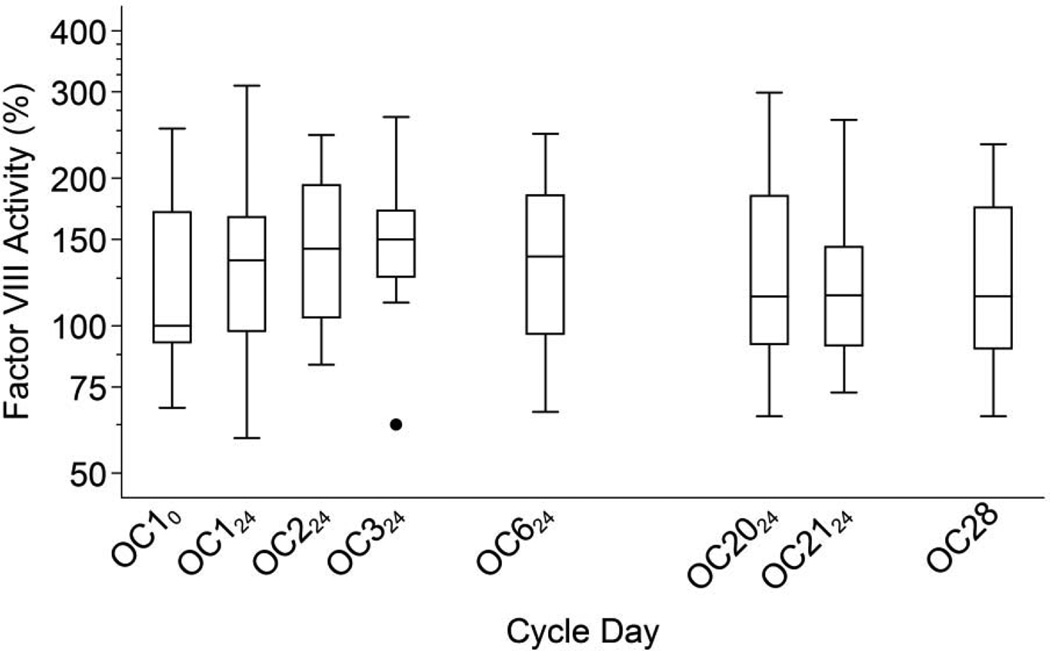
Fig. 4.
Factor VIII activity levels during the OC cycle. Boxes show medians and interquartile ranges (IQR); lower whiskers denote the smallest values ≥ (25th percentile − 1.5 × IQR); upper whiskers denote the largest values ≤ (75th percentile + 1.5 × IQR); and individual points denote D-dimer values outside the whiskers [35].

