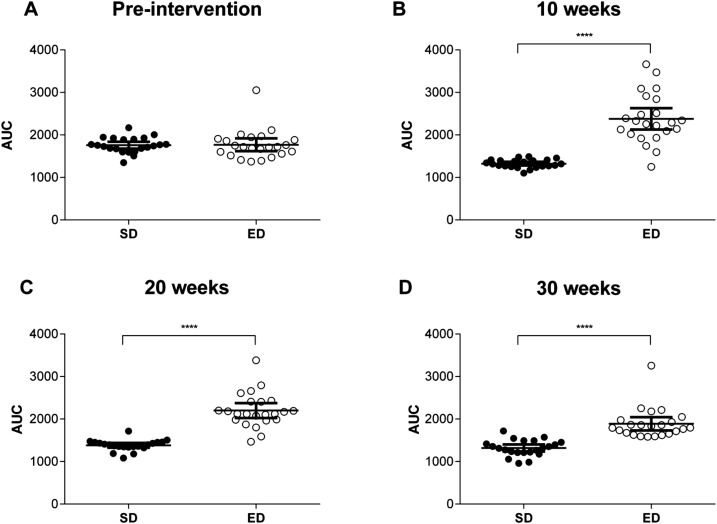
Fig. 2.
Impaired glucose tolerance in mice fed an energy-dense (ED) diet. At baseline (A), 10 weeks (B) 20 weeks (C) and 30 weeks (D) after commencement of dietary intervention, glucose concentrations were measured at 15, 30, 60 and 120 min post intraperitoneal glucose load (2 g kg−1) for control mice fed a standard (SD; n=22) and ED (n=23) diet and the area under the curve (AUC) for glucose levels following the glucose tolerance test (GTT) determined. Data are mean±95% c.i. Significant differences were analysed by two-way ANOVA and Sidak's multiple comparison post-tests for GTT and Student's t-test for AUC and indicated as ***P≤0.001.

