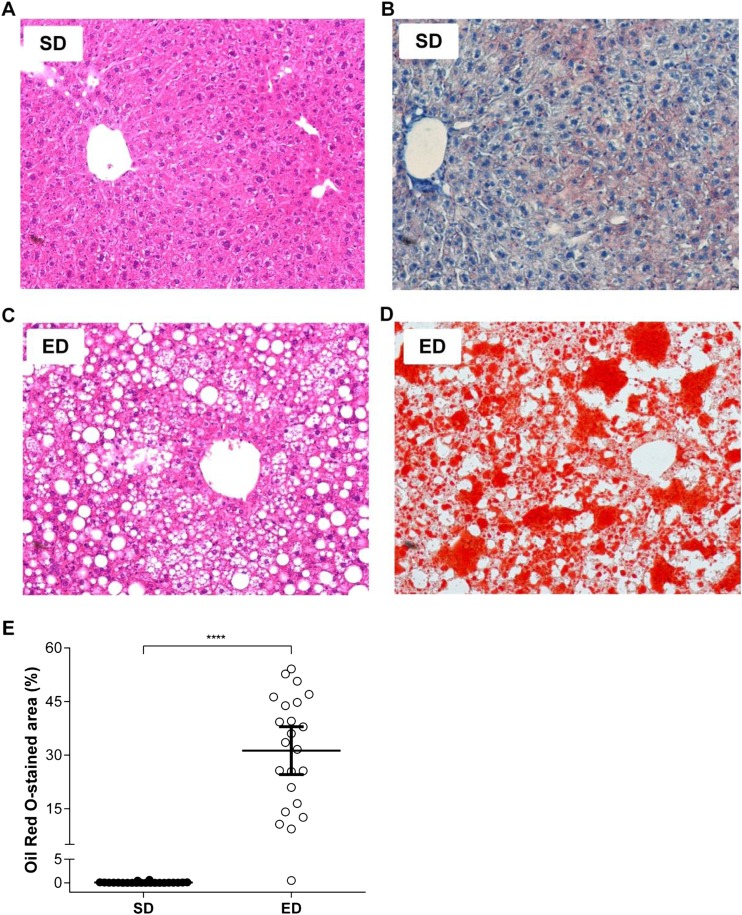
Fig. 6.
Hepatic steatosis in mice fed an energy-dense (ED) diet. (A-D) Photomicrographs of representative liver sections from mice fed a standard (SD; n=22) or ED (n=23) diet for 30 weeks that were stained with (A,C) H&E or (B,D) Oil Red O. 400× magnification (E) The percentage of Oil Red O staining within sections was compared using digital analysis software and demonstrates marked hepatic steatosis in ED diet-fed mice, compared with control mice. Data are mean±95% c.i. Significant differences were analysed by Student's t-test with Welch's correction and indicated as ***P≤0.001.

