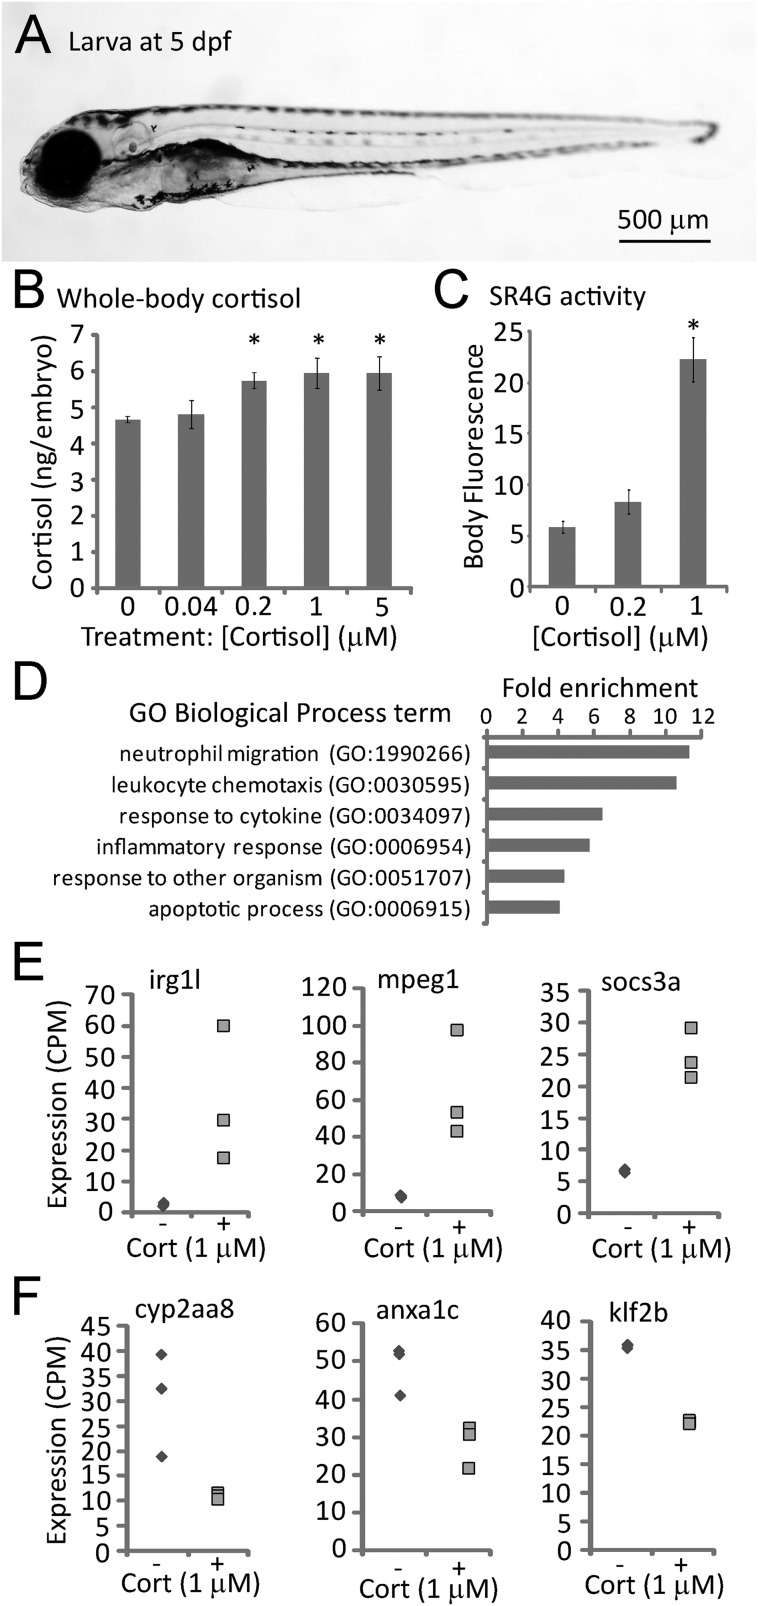
Fig. 1.
Effects of cortisol treatment on zebrafish larval cortisol levels, glucocorticoid receptor activity and gene expression. (A) Typical larva at 5 days post-fertilization (dpf). (B) Whole-body cortisol levels after exposure to varying doses of cortisol from 0-5 dpf, measured by ELISA of larval extracts (30 larvae per sample, duplicate measurements of each sample; P=0.015 by one-way ANOVA; * indicates that the difference from untreated controls is statistically significant by post hoc Tukey's test). (C) GFP fluorescence in the glucocorticoid receptor-responsive reporter line SR4G at 5 dpf following treatment with the indicated concentrations of cortisol (20 larvae imaged per sample; P=7.29×10⁻¹¹ by a one way ANOVA; * indicates that the difference from untreated controls is statistically significant by post hoc Tukey's test). (D) Gene ontology biological process parent terms found by PANTHER to be significantly (P<0.05) overrepresented in the list of genes differentially expressed in 5 day old embryos treated with 1 μM cortisol. (E) RNA-seq measurements of three genes found to be upregulated in embryos treated (+) with 1 μM cortisol, compared to untreated controls (−). (F) RNA-seq measurements of three genes found to be downregulated in 1 μM cortisol-treated embryos (+) compared to untreated controls (−). Differences in expression between control and treatment groups shown in E and F are all statistically significant (P<0.05). Error bars in B and C depict standard error of the mean (s.e.m.).

