
Fig. 2.
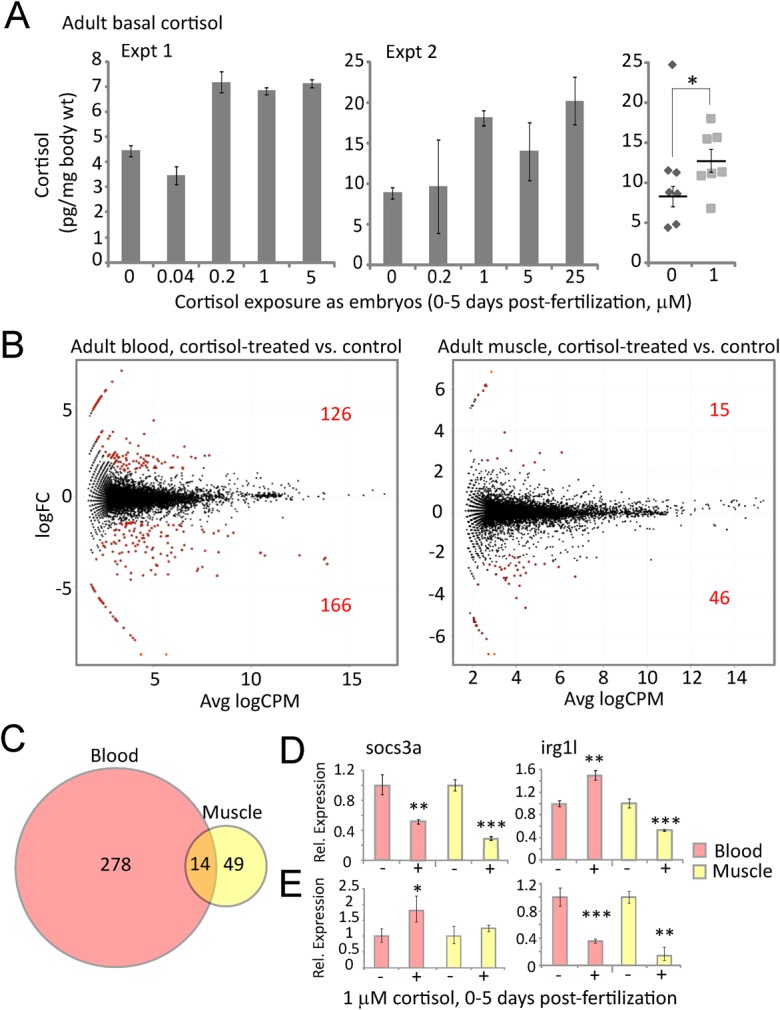
Effects of early developmental exposure to cortisol on adult basal cortisol levels and gene expression in blood and muscle cells. (A) Cortisol levels measured by ELISA of whole body extracts from individual 7-month-old adults derived from three experimental cohorts exposed as embryos to the indicated concentrations of cortisol from 0-5 dpf. Error bars in the first two graphs depict standard deviations (s.d.) for technical replicates; for the third graph showing combined data from all three experiments, the error bars represent s.e.m. for biological replicates. For the third experiment a power analysis was performed which determined that a minimum of five individuals was needed for statistically significant results based on the effect sizes obtained in the first two. Statistical significance *P=0.04 by a two-tailed t-test, excluding the single outlier (Q-test, Qexp=0.649>Qcrit=0.569, P<0.05) in the control group. (B) Scatter plots of average expression level and fold-change in expression for each gene in blood and muscle tissue from 4.5-month-old adults derived from embryos treated with 1 μM cortisol and untreated controls. Red dots indicate genes with significantly different expression (P<0.05) between the two groups, the numbers of which (over- and under-expressed) are also shown in red. (C) Venn diagram showing numbers of differentially expressed genes in blood and muscle, and the overlap between the two (14 genes, listed in Table 1). (D,E) qRT-PCR measurements of socs3a and irg1l in blood and muscle tissue from cortisol treated embryos (+) and untreated control embryos (−) from (D) 9-month-old zebrafish from the same experimental cohort from which the RNA-seq results shown in B and C were obtained, and (E) 5-month-old zebrafish from a different experimental cohort. Statistical significance *P<0.05, **P<0.01, ***P<0.001 by an unpaired t-test, the error bars represent s.d.