FIGURE 3.

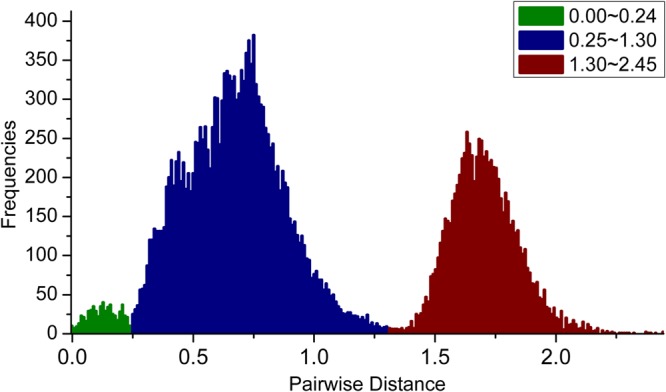
Frequency distribution of pairwise genetic distances (transitions and transversions) for PKS III genes. Three peaks, with genetic distances ranging from 0–0.25, 0.25–1.3, and 1.3–2.5, are shown in green, blue, and red, respectively.

Frequency distribution of pairwise genetic distances (transitions and transversions) for PKS III genes. Three peaks, with genetic distances ranging from 0–0.25, 0.25–1.3, and 1.3–2.5, are shown in green, blue, and red, respectively.