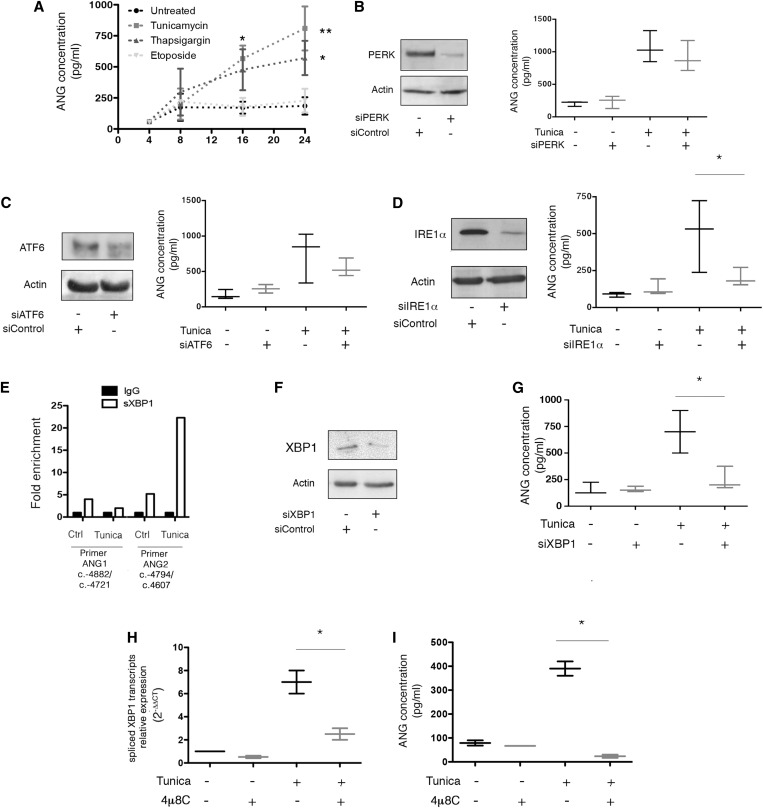
Figure 1.
ER stress induces ANG expression in renal epithelial cells. (A) Graph representing the mean±SEM of ANG concentration measured by ELISA in the extracellular medium during a time course experiment on HREC incubated with 2.5 μg/ml tunicamycin, 0.25 μM thapsigargin, 100 μM etoposide or vehicle. Data are representative of four independent experiments, *P<0.05; **P<0.01; one-way ANOVA, with Dunnett’s test for multiple comparisons to compare treated samples with a single control. (B) (Left) Immunoblot representing PERK and actin expression at the protein level in HREC 24 hours after transfection of a siRNA targeting PERK mRNA. The immunoblot shown is representative of three independent experiments. (Right) Box-and-whisker plots representing ANG concentration measured by ELISA in the extracellular medium of HREC transfected with a siRNA targeting PERK, or a scrambled siRNA, and incubated with 2.5 μg/ml tunicamycin or vehicle for 24 hours. Data are from three independent experiments. (C) (Left) Immunoblot representing ATF6 and actin expression at the protein level in HREC 24 hours after transfection of a siRNA targeting ATF6 mRNA. The immunoblot shown is representative of three independent experiments. (Right) Box-and-whisker plots representing ANG concentration measured by ELISA in the extracellular medium of HREC transfected with a siRNA targeting ATF6, or a scrambled siRNA, and incubated with 2.5 μg/ml tunicamycin or vehicle for 24 hours. Data are from three independent experiments. (D) (Left) Immunoblot representing IRE1α and actin expression at the protein level in HREC 24 hours after transfection of a siRNA targeting IRE1α mRNA. The immunoblot shown is representative of three independent experiments. (Right) Box-and-whisker plots representing ANG concentration measured by ELISA in the extracellular medium of HREC transfected with an siRNA targeting IRE1α, or a scrambled siRNA, and incubated with 2.5 μg/ml tunicamycin or vehicle for 24 hours. Data are from three independent experiments. Mann–Whitney U test: *P<0.05. (E) Histograms representing the results of a ChIP assay of sXBP1, followed by amplification through the RT-qPCR of ANG promoter using primers targeting the promoter. HREC were incubated with 2 μg/ml tunicamycin or vehicle for 2 hours. The graph is representative of two experiments. (F) Immunoblot representing XBP1 and actin expression at the protein level in HREC 24 hours after transfection of an siRNA targeting IRE1α mRNA. The immunoblot shown is representative of three independent experiments. (G) Box-and-whisker plots representing ANG concentration measured by ELISA in the extracellular medium of HREC transfected with an siRNA targeting XBP1, or a scrambled siRNA, and incubated with 2.5 μg/ml tunicamycin or vehicle for 24 hours. Data are from three independent experiments. Mann–Whitney U test: *P<0.05. (H) Box-and-whisker plots representing sXBP1 transcripts relative expression in HREC incubated with 10 μM 4μ8C, or vehicle, and with 2 μg/ml tunicamycin or vehicle, for 24 hours, measured using RT-qPCR. Data are from three independent experiments. Mann–Whitney U test: *P<0.05. (I) Box-and-whisker plots representing ANG concentration in the HREC culture medium, measured by ELISA, after incubation with 10 μM 4μ8C, or vehicle, and with 2.5 μg/ml tunicamycin or vehicle, for 24 hours, measured using RT-qPCR. Data are from three independent experiments. Mann–Whitney U test: *P<0.05.

