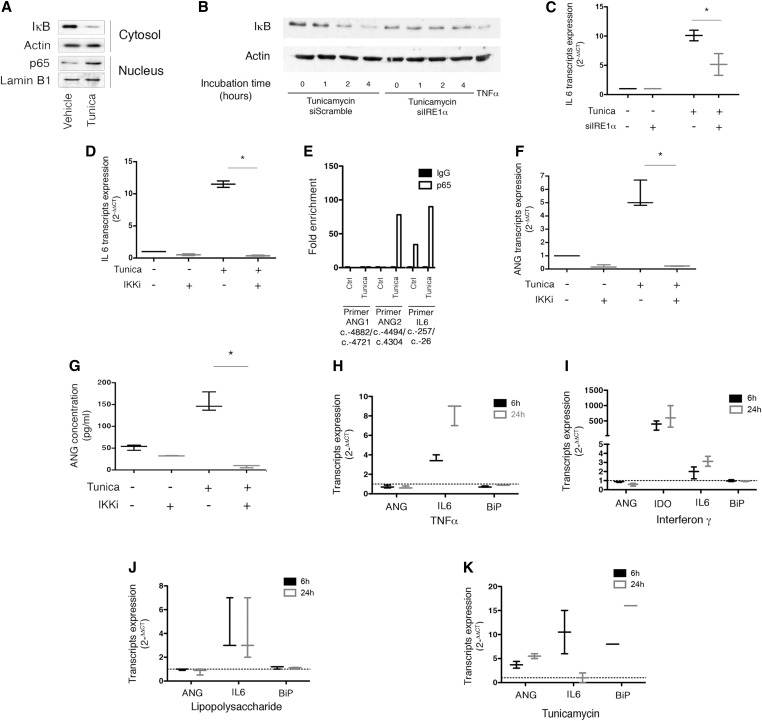
Figure 2.
NF-κB regulates ANG expression and secretion under ER stress. (A) Immunoblot representing IκB and actin expression at the protein level in HREC cytosols, and p65 and lamin B1 in HREC nuclei after 2 hours of incubation with 2.5 μg/ml tunicamycin or vehicle. The immunoblot shown is representative of three independent experiments. (B) Immunoblot representing IκB and actin expression at the protein level in HREC transfected with an siRNA targeting IRE1α, or a scrambled siRNA, and incubated with 2.5 μg/ml tunicamycin or vehicle. The immunoblot shown is representative of three independent experiments. (C) Box-and-whisker plots representing IL6 transcripts relative expression analyzed by RT-qPCR in HREC transfected with an siRNA targeting IRE1α, or a scrambled siRNA, and incubated with 2.5 μg/ml tunicamycin or vehicle for 24 hours. Data are from three independent experiments. Mann–Whitney U test: *P<0.05. (D) Box-and-whisker plots representing IL6 transcripts relative expression analyzed by RT-qPCR in HREC incubated 24 hours with 2.5 μg/mL tunicamycin or vehicle, and coincubated with 1 μM inhibitor of IKK (IKK2 inhibitor, BMS345541). Data are from three independent experiments. Mann–Whitney U test: *P<0.05. (E) Histograms representing the results of a ChIP assay of p65 followed by the amplification by RT-qPCR of ANG promoter using two different primers targeting two different regions of the promoter, and IL6 promoter as a positive control. HREC were incubated with 2.5 μg/ml tunicamycin or vehicle for 2 hours. The histogram is representative of two independent experiments. (F) Box-and-whisker plots representing ANG transcripts relative expression analyzed by RT-qPCR in HREC incubated for 16 hours with 2.5 μg/ml tunicamycin or vehicle, and coincubated with 1 μM BMS345541. Data are from three independent experiments. Mann–Whitney U test: *P<0.05. (G) Box-and-whisker plots representing ANG concentrations measured by ELISA in the extracellular medium of HREC incubated with 2.5 μg/mL tunicamycin or vehicle and coincubated with 1 μM BMS345541 for 24 hours. Data are from three independent experiments. Mann–Whitney U test: *P<0.05. (H) Box-and-whisker plots representing ANG, IL6, and BiP transcripts relative expression analyzed by RT-qPCR in HREC incubated for 6 or 24 hours with 10 ng/mL TNFα or vehicle. Data are from three independent experiments. The dotted line represents 1, the expression level of transcripts in the control condition when measured by the 2(–∆∆CT) method. (I) Box-and-whisker plots representing ANG, indoleamine 2–3 dioxygenase, IL6, and BiP transcripts relative expression analyzed by RT-qPCR in HREC incubated for 6 or 24 hours with 10 ng/mL IFNγ or vehicle. Data are from three independent experiments. The dotted line represents 1, the expression level of transcripts in the control condition when measured by the 2(–∆∆CT) method. (J) Box-and-whisker plots representing ANG, IL6, and BiP transcripts relative expression analyzed by RT-qPCR in HREC incubated for 6 or 24 hours with 10 μg/mL LPS or vehicle. Data are from three independent experiments. The dotted line represents 1, the expression level of transcripts in the control condition when measured by the 2(–∆∆CT) method. (K) Box-and-whisker plots representing ANG, IL6, and BiP transcripts relative expression analyzed by RT-qPCR in HREC incubated for 6 or 24 hours with 2.5 μg/ml tunicamycin or vehicle. The dotted line represents 1, the expression level of transcripts in the control condition when measured by the 2(–∆∆CT) method. Data are from three independent experiments.

