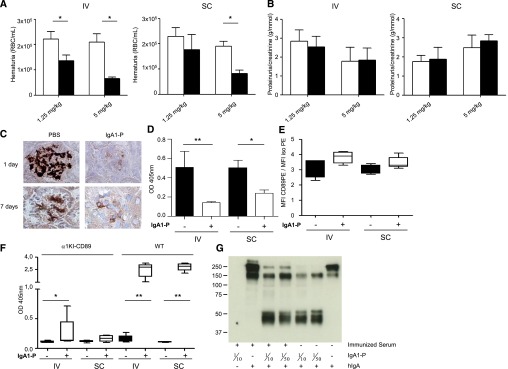
Figure 4.
Decrease of hematuria and IgA1 deposits after a longer treatment with IgA1‑P despite the production of antibodies recognizing IgA1‑P. (A) Hematuria counts in α1KI-CD89Tg mice before and 1 week after three IgA1‑P injections (red blood cells [RBC]/ml). (B) Proteinuria in α1KI-CD89Tg mice before and 1 week after three IgA1‑P injections. (C) Immunohistochemistry of frozen kidney sections from four treated α1KI-CD89Tg mice using antibodies against human IgA. Mice were injected four times during 3 weeks and euthanized the day after the last injection (1 day) or 1 week later (7 days). (D) Levels of IgA1–sCD89 complexes in vehicle (–) or IgA1‑P (+) treated mouse serum assessed by ELISA. (E) CD89 expression on vehicle (–) or IgA1‑P (+) treated mouse splenic CD11b-positive cell surface analyzed by flow cytometry. The results are displayed as the ratio of CD89 mean fluorescent intensity (MFI) to control isotype MFI. (F) Anti–IgA1‑P IgG in vehicle (–) or IgA1‑P (+) treated mouse serum 3 weeks after the first of four injections. (G) The capacity of IgA1‑P to cleave IgA1 was tested by incubating the serum of an IgA1‑P-immunized wild-type mouse with IgA1‑P and then adding hIgA1. Cleavage was detected by a western blot targeting IgA. n=5 mice per group. Empty bars represent the PBS-treated animals, and filled bars show mice treated with IgA1‑P. *P<0.05; **P<0.01 Wilcoxon or Mann–Whitney test.

