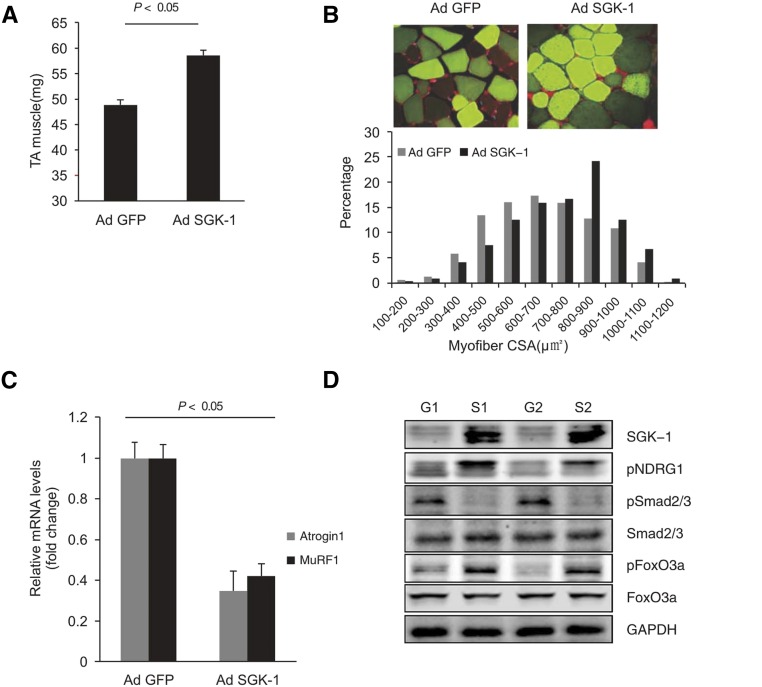
Figure 5.
Overexpression of SGK-1 reverses CKD–induced muscle atrophy. (A) TA muscles were injected with AdGFP or AdSGK-1, and after 1 month, TA muscle weights were measured (n=10 pairs of mice; P<0.05 versus GFP mice). (B) Cross-sections of TA muscles were stained with GFP (green) and laminin (red). Myofiber areas were measured, and their distribution was calculated as in Figure 2. (C) The expressions of Atrogin1 and MuRF1 were determined by RT-PCR (n=5 pairs of mice; P<0.05 versus GFP mice). (D) Western blots was performed to examine the indicated molecules (n=5). AdGFP, GFP adenovirus; CSA, cross-sectional area; G1, sample 1 with adGFP; G2, sample 2 with AdGFP; GAPDH, glyceraldehyde-3-phosphate dehydrogenase; GFP, green fluorescent protein; S1, sample 1 with AdSGK-1; S2, sample 2 with AdSGK-1.

