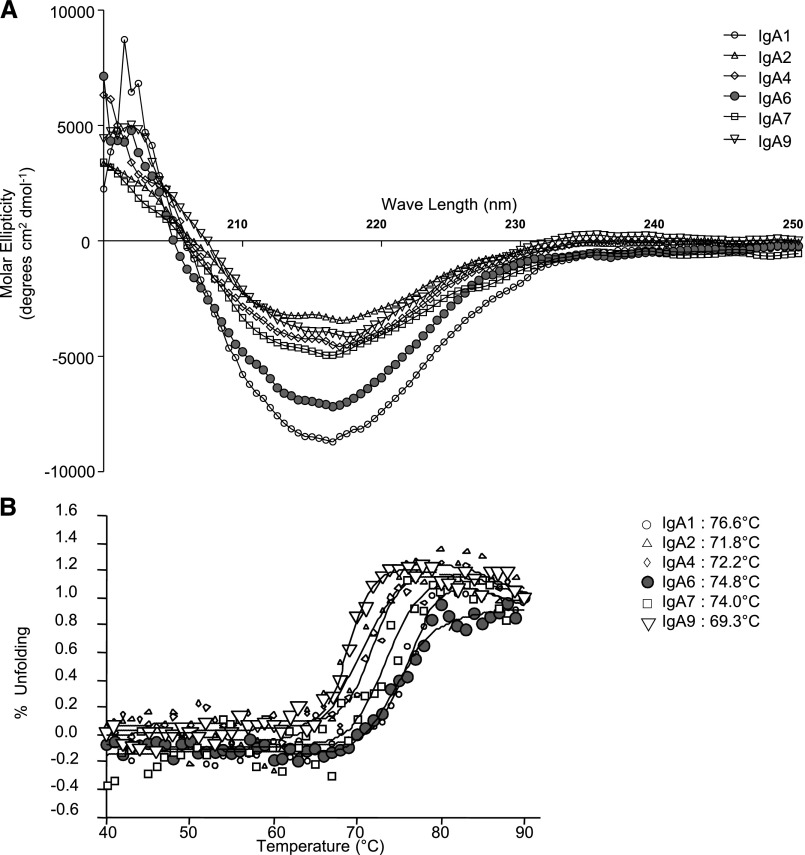
Figure 10.
Circular dichroism analysis of IgA1 mAbs. (A) Far-ultraviolet spectra of six mAbs acquired at 20°C with a path length of 0.2 cm on a spectropolarimeter. IgA1 mAb1 and IgA1 mAb6 yield IgA deposition, and the others do not. (B) Thermal unfolding analysis of six IgA1 mAbs. Heat denaturation temperatures are indicated on the right.

