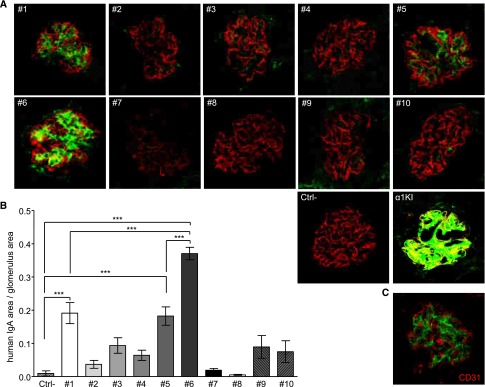
Figure 6.
Analysis of IgA deposition in the kidney of immunodeficient mice 2 hours after injection of human IgA1 mAb. Clones 1–10 were injected in two mice each. Ctrl− is a negative control after injection of saline. (A) IgA deposits in kidney sections labeled with FITC–conjugated anti–human IgA (green) and AlexaFluor568-linked antipodocin (red). (B) Quantification of IgA staining by image analysis. Results are means±SEMs of n=20 glomeruli (Kruskall–Wallis test followed by Bonferroni test). ***P<0.001. (C) Confocal microscopy imaging of IgA (green) and endothelial CD31+ cells (red) in kidney sections from a mouse administered IgA1 mAb6. A and C are representative of all of the glomeruli analyzed in sections of n=2 mice.

