Figure 3.
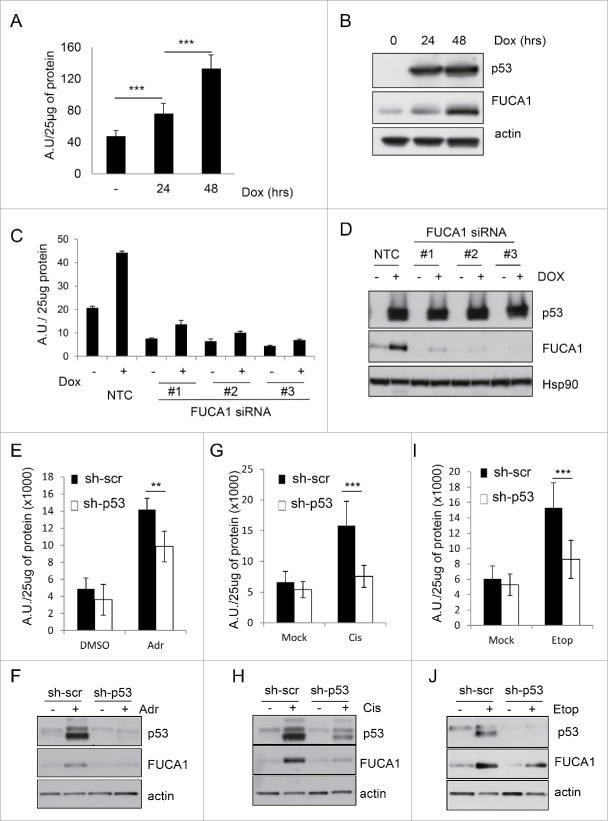
FUCA1 protein level and activity increase following p53 expression. (A-B) TetOn-p53wt Saos2 cells were treated with doxycycline (Dox) for 24 and 48 hours. Fuca1 activity (A) was measured following Dox treatment and expressed as arbitrary units (A.U.) per 25 µg of protein (n = 3 independent experiement, 9 replicates, one way Anova ***p < 0.0001). (B) FUCA1 and p53 expression was assessed by western blotting and immunoblot against actin was used as a loading control. (C-D) TetOn-p53wt Saos2 cells were transfected with 3 different siRNA directed against FUCA1, prior to doxycycline treatment. Fuca1 enzymatic activities were assessed 48 hours after p53 induction, expressed as arbitrary unit (A.U) per 25 µg of protein and represented as mean ± SD. The graph shown represnts data from one representative experiment done with 3 technical replicates. p53 and Fuca1 expression were assessed by Western blotting and immunoblot against Hsp90 was used as a loading control. RKO expressing scrambled (pRS-Scr) or p53-specific (pRS-p53) shRNAs were either Adriamycin (Adr)(0.5 μg/ml) (E-F), Cisplatin (Cis) (20 µM ) (G-H) or Etoposide (Etop) (20 μm) (I-J) for 48 hr. FUCA1 activity was assessed and expressed as arbitrary units (A.U.) per 25 µg of protein (n = 3 independent experiement, 9 replicates, one way Anova **p = 0.0008, ***p < 0.0001). (E,G,I). FUCA1 and p53 expression was assessed by western blotting and immunoblot against actin was used as a loading control (F,H,J).

