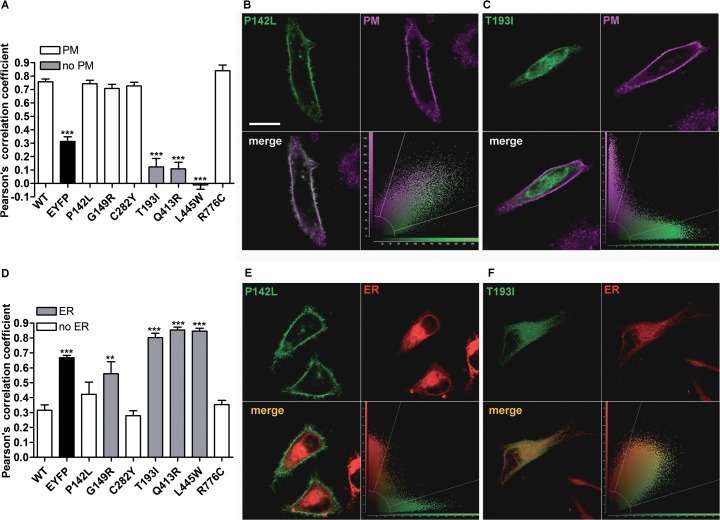
Figure 2.
Subcellular localization of wild-type pendrin and its variants. (A) Pearson correlation coefficient referred to the colocalization of wild-type (WT) pendrin and its variants with the PM. ***p < 0.001 compared with wild-type and therefore excluded from the plasma membrane, 9 ≤ n ≤ 25, one-way ANOVA with Bonferroni multiple comparison posttest. Representative examples of pendrin protein variants colocalizing with (B) or excluded from (C) the PM. The corresponding merge images (lower left) and scatterplots (lower right) are shown. Scale bar: 20 μm. (D) Pearson correlation coefficient referred to the colocalization of wild-type pendrin and its variants with the ER. 6 ≤ n ≤ 10, ***p < 0.001 compared with wild-type and therefore colocalizing with the ER, one-way ANOVA with Bonferroni multiple comparison posttest. Representative examples of pendrin protein variants excluded from (E) or colocalizing with (F) the ER. The corresponding merge images (lower left) and scatterplots (lower right) are shown.

