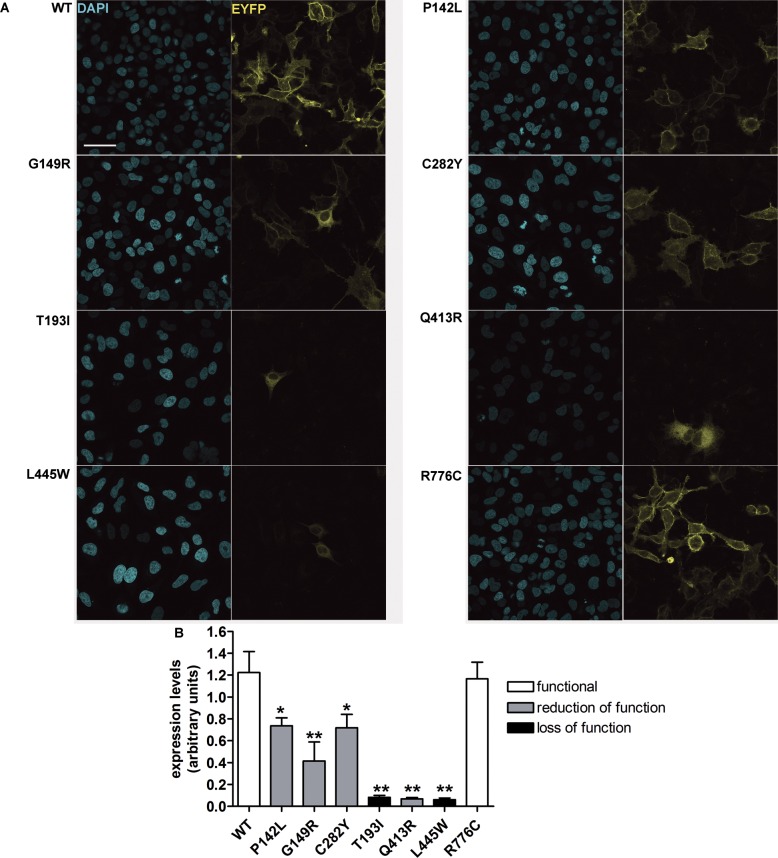
Figure 3.
Global cellular levels of wild-type pendrin and pendrin variants in intact cells. (A) Wild-type (WT) and mutated pendrin-EYFP (yellow signal) were expressed in HeLa cells. Cells were fixed and nuclei counterstained with DAPI (blue signal) to quantify the cell density. Scale bar: 50 μm. (B) Wild-type (WT) and mutated pendrin total expression levels expressed as fluorescence intensity (levels of gray) normalized for the cell density. n = 16, **p < 0.01, *p < 0.05 compared with wild-type, one-way ANOVA with Dunnett multiple comparison posttest.

