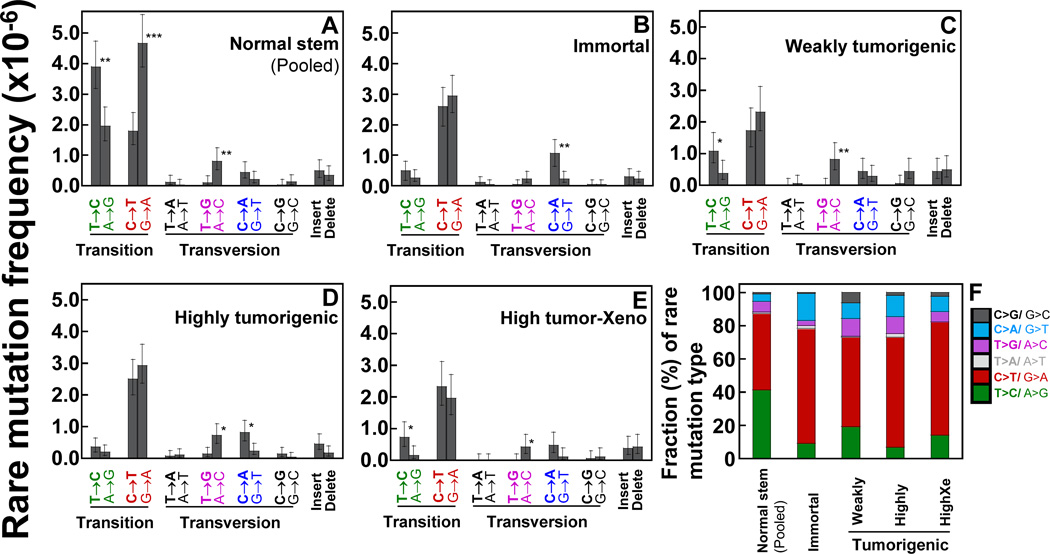
Figure 3.
Types of rare point mutations and insertions and deletions in the whole mtDNA were determined using DCS analysis of Duplex Sequencing. Data are from normal human breast stem cells (A) and transformed cells [immortal (B), weakly tumorigenic (C), highly tumorigenic (D), and highly tumorigenic xenograft cells]. (A–E) Error bars represent the Wilson Score 95% confidence intervals. Significant differences between two groups are indicated (p values <0.05 (*), <5×10⁻⁴ (**), and <5×10⁻⁵ (***) by the Chi-square test). (F) Each mutation type is presented as a percentage (%) of overall rare mutations for each set of cells.

