Figure 1.
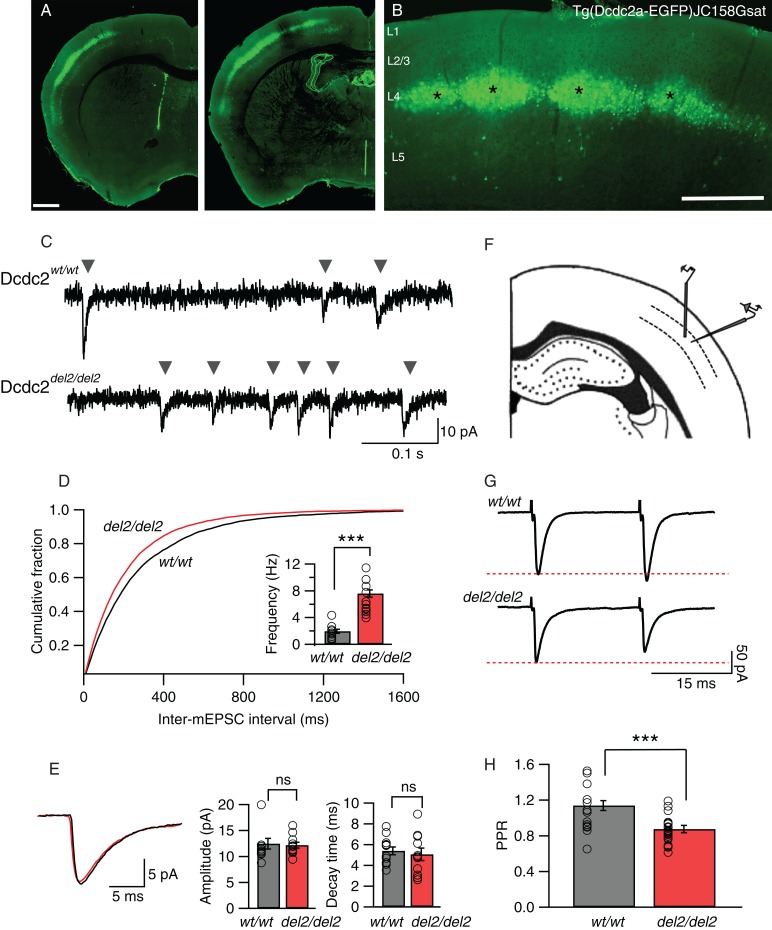
Somatosensory layer 4 neurons in Dcdc2del2/del2 mice show increased glutamatergic synaptic activity. (A) Cells labeled by a BAC GFP transgene in the Dcdc2-EGFP GENSAT mouse [Tg(Dcdc2a-EGFP)JC158Gsat] are primarily within layer 4 of neocortex. (B) Somatosensory neocortex contains the highest density of GFP-positive neurons. Cortical layers 1–5 are labeled. Asterisks indicate sample barrels. Scale bars: A: 500 µm, B: 100 µm. (C) Sample traces of AMPAR-mediated mEPSCs from a Dcdc2wt/wt (top) and a Dcdc2del2/del2 (bottom). Gray arrowheads indicate individual events. (D) Cumulative probability histogram for inter-mEPSC interval for Dcdc2wt/wt and Dcdc2del2/del2 neurons. The histogram is from 11 recorded cells in Dcdc2del2/del2 and 12 cells in Dcdc2wt/wt layer 4 somatosensory cortex. Kolmogorov–Smirnov test, P < 0.05. Inset, mean mEPSC frequency for Dcdc2wt/wt and Dcdc2del2/del2 neurons (P < 0.0001). (E) Average mEPSC waveforms (Dcdc2wt/wt: black, Dcdc2del2/del2: red), mean amplitude (P= 0.83) and decay time (P = 0.63) for Dcdc2del2/del2 and Dcdc2wt/wt. Student's t-test, Dcdc2wt/wt: n = 12, Dcdc2del2/del2: n = 11. (F) Schematic of the somatosensory cortical slice and approximate placements of recording and stimulating electrodes. (G) Representative synaptic responses in paired-pulse stimulation experiments in a Dcdc2wt/wt and a Dcdc2del2/del2 layer 4 neuron. Red-dotted line indicates the level of the first synaptic response in each pair. (H) Bar graph showing paired-pulse ratios (PPR, second response amplitude/first response amplitude) for recordings within layer 4 of Dcdc2del2/del2 and Dcdc2wt/wt neocortex (P = 0.001). Student's t-test; Dcdc2wt/wt: n = 15, Dcdc2del2/del2: n = 27. Open circles indicating individual neurons. ***P < 0.001; ns, P > 0.05.

