Figure 4.
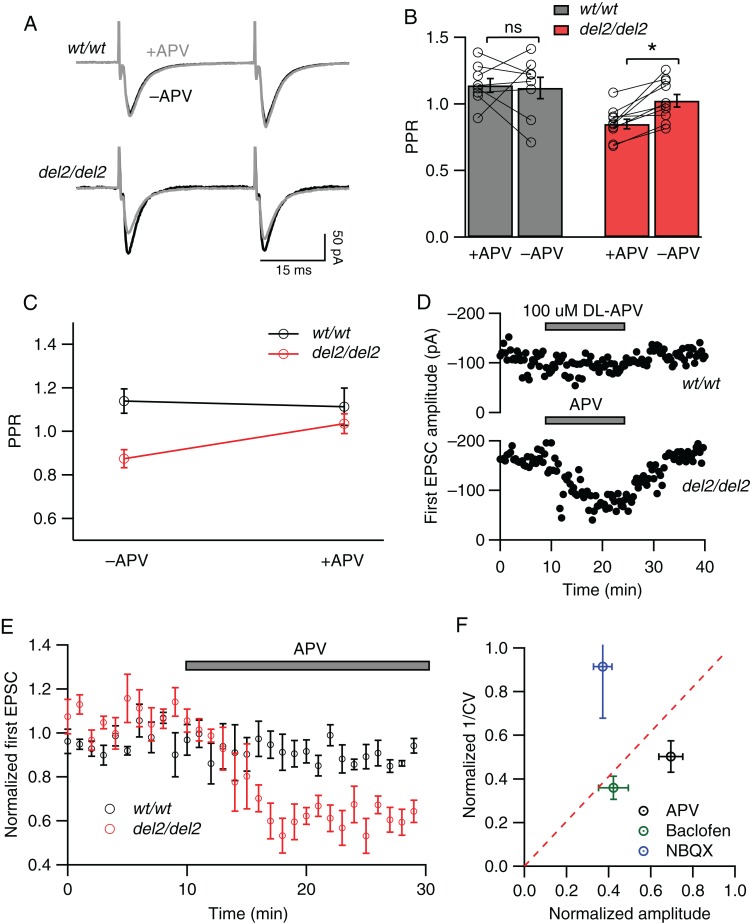
Blockade of NMDARs reduces probability of evoked release in Dcdc2del2/del2 but not Dcdc2wt/wt mice. (A) Representative paired-pulse responses elicited by extrasynaptic electrical stimulation in a Dcdc2wt/wt (top) and Dcdc2del2/del2 (bottom) layer 4 excitatory cell before (black) and after (gray) APV application. (B) Effects of APV application on PPR in Dcdc2wt/wt (gray bars) and Dcdc2del2/del2 (red bars) neurons. Open circles connected with lines indicate individual neurons. (C) Interaction graph showing the mean paired-pulse ratios for Dcdc2wt/wt and Dcdc2del2/del2 neurons before and after APV. Repeated-measures ANOVA, genotype × APV application interaction: F1,16 = 5.05, P < 0.05. Followed by Bonferroni's multiple comparisons test within genotype (significance indicated in B): Dcdc2wt/wt: adjusted P > 0.05; Dcdc2del2/del2: P < 0.05). Dcdc2wt/wt: n = 8, Dcdc2del2/del2: n = 10. (D) Representative plot of peak amplitudes of the first AMPA-mediated EPSCs over time in a Dcdc2wt/wt (upper) and Dcdc2del2/del2 (lower) layer IV neuron before, during, and after APV application. Pairs of stimulations were delivered every 20 s. (E) Averages of normalized first EPSC amplitudes in Dcdc2wt/wt (n = 5; black circles) and Dcdc2del2/del2 (n = 6; red circles) neurons showing the absence of APV effect in Dcdc2wt/wt and decrease in amplitudes in Dcdc2del2/del2 mice. Every 3 EPSCs were averaged (covering 1-min period), and normalized to the mean of the first minute. (F) CV analysis of Dcdc2del2/del2 neurons by plotting EPSC amplitude ratio versus 1/CV2 ratio (postdrug/predrug) after and before NBQX (0.3 µM; blue circle, n = 6), baclofen (5 µM; green circle, n = 4), and DL-APV (100 µM; black circle, n = 12). Data points falling above the red-dotted line indicate a postsynaptic site of action, and those below a presynaptic site of action. *P < 0.05; ns, P > 0.05.

