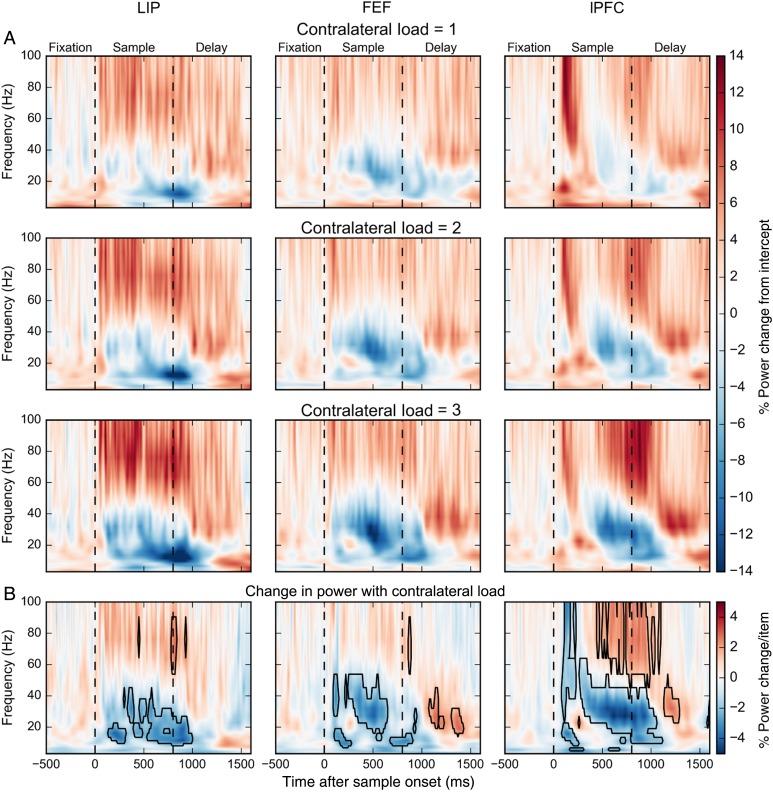
Figure 2.
(A) Percent power change for contralateral loads 1, 2, and 3 relative to the model intercept across frequencies and time. First dashed line indicates time of sample onset. Second dashed line indicates time of sample offset. (B) Percent power change per contralateral stimulus. Boxes indicate significant modulations (bootstrap Z-test, P < 0.05, Holm corrected for 22 frequencies × 211 time points).

