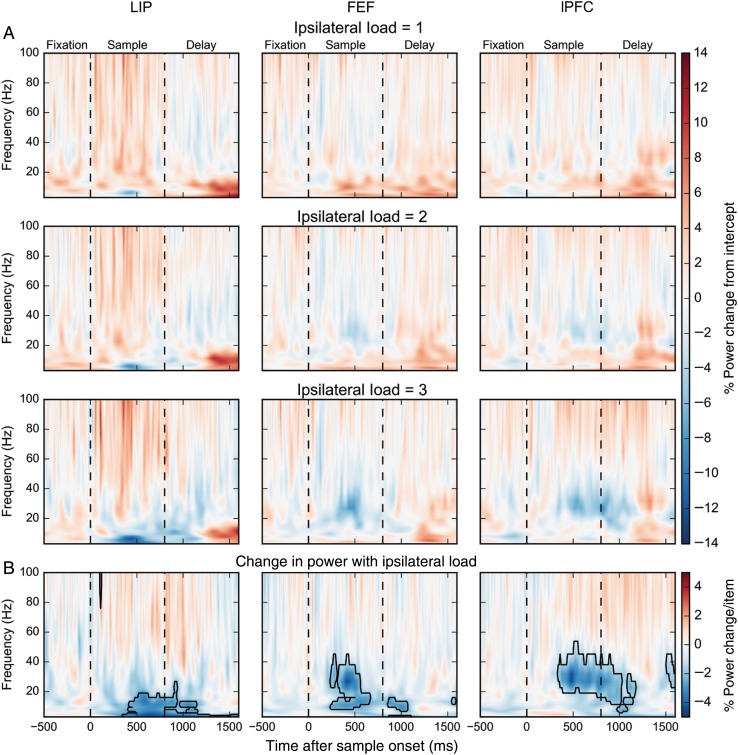
Figure 3.
(A) Percent power change for ipsilateral loads 1, 2, and 3 relative to the model intercept across frequencies and time. (B) Percent power change per ipsilateral stimulus. Boxes indicate significant modulations (bootstrap Z-test, P < 0.05, Holm corrected for 22 frequencies × 211 time points).

