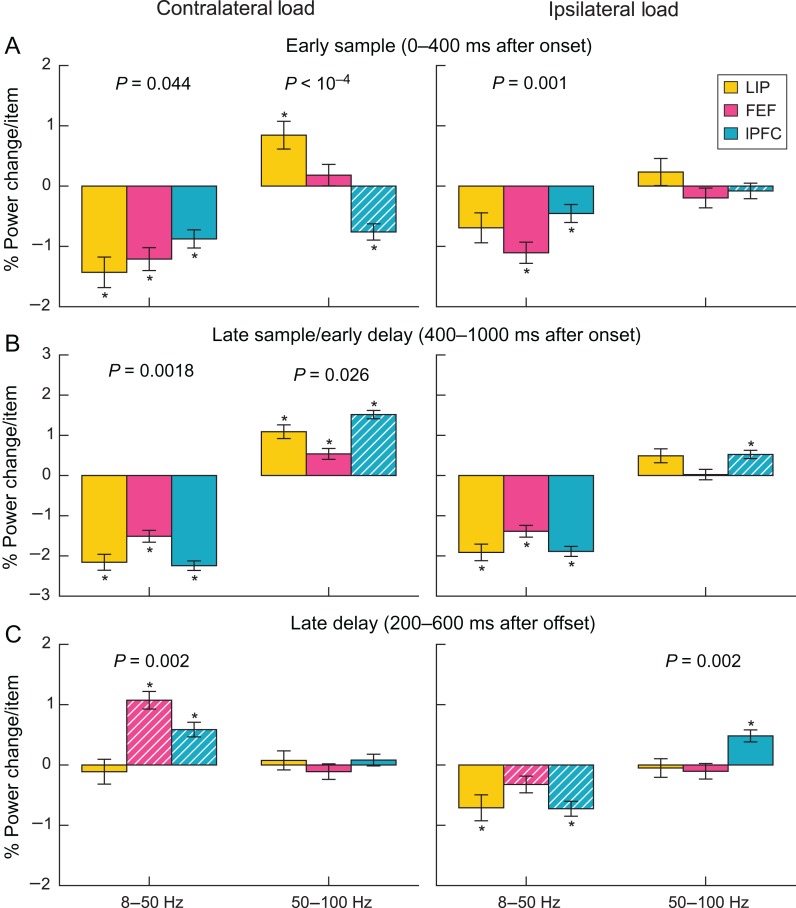
Figure 4.
Percent power change per contralateral (left) and ipsilateral (right) item by region, grouped by lower frequencies (left bar group) and higher frequencies (right bar group) during the early sample (A), late sample/early delay (B), and late delay (C). Error bars are standard error of the mean. Asterisks indicate significant differences (bootstrap Z-test, P < 0.05, Holm corrected for 2 bands × 3 epochs × 3 regions). White hatching indicates significant differences in modulation by ipsilateral and contralateral load (bootstrap Z-test, P < 0.05, Holm corrected). P-values above bars indicate significant differences between regions (F-test, P < 0.05).

