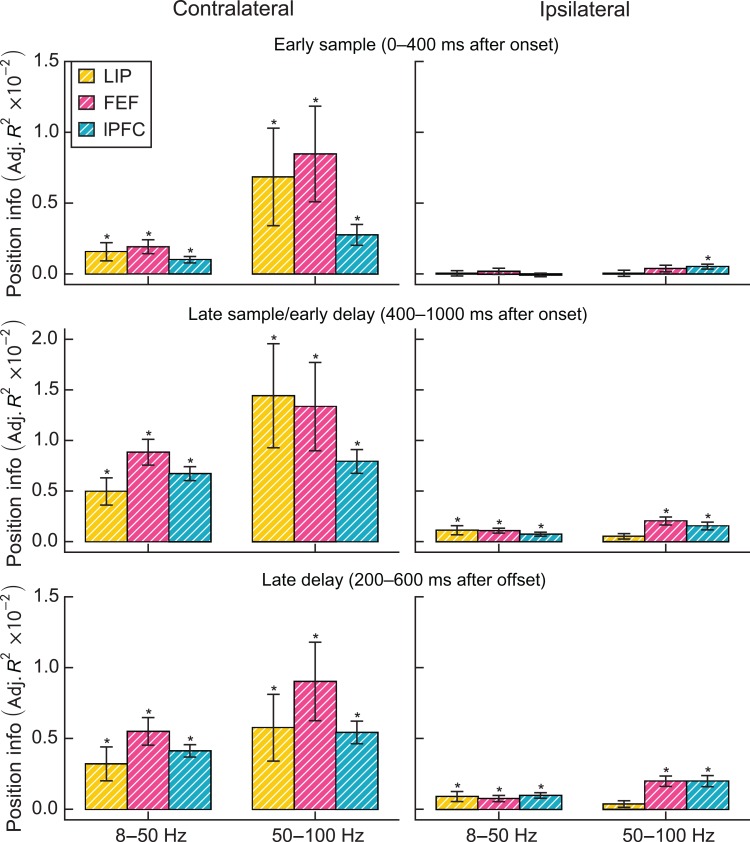
Figure 6.
Comparison of position information (adjusted R2) for contralateral and ipsilateral stimuli. Error bars are standard error of the mean. Asterisks indicate significant information (nonparametric bootstrap test, P < 0.05, Holm corrected for 2 bands × 3 epochs × 3 regions). White hatching indicates significant differences in modulation by ipsilateral and contralateral load (nonparametric paired bootstrap test, P < 0.05, Holm corrected).

