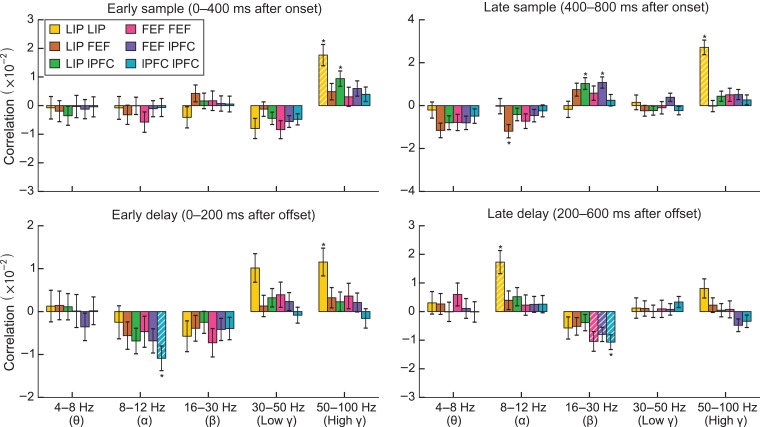
Figure 9.
Correlation of single-trial coherence surrogates with contralateral load for frequency bands and epochs. Asterisks indicate significant differences (bootstrap Z-test, P < 0.05, Holm corrected for 5 bands × 4 epochs × 6 region pairs). White hatching indicates significant differences in modulation by ipsilateral and contralateral load (bootstrap Z-test, P < 0.05, Holm corrected). The same analysis for ipsilateral load is shown in Supplementary Figure S3.

