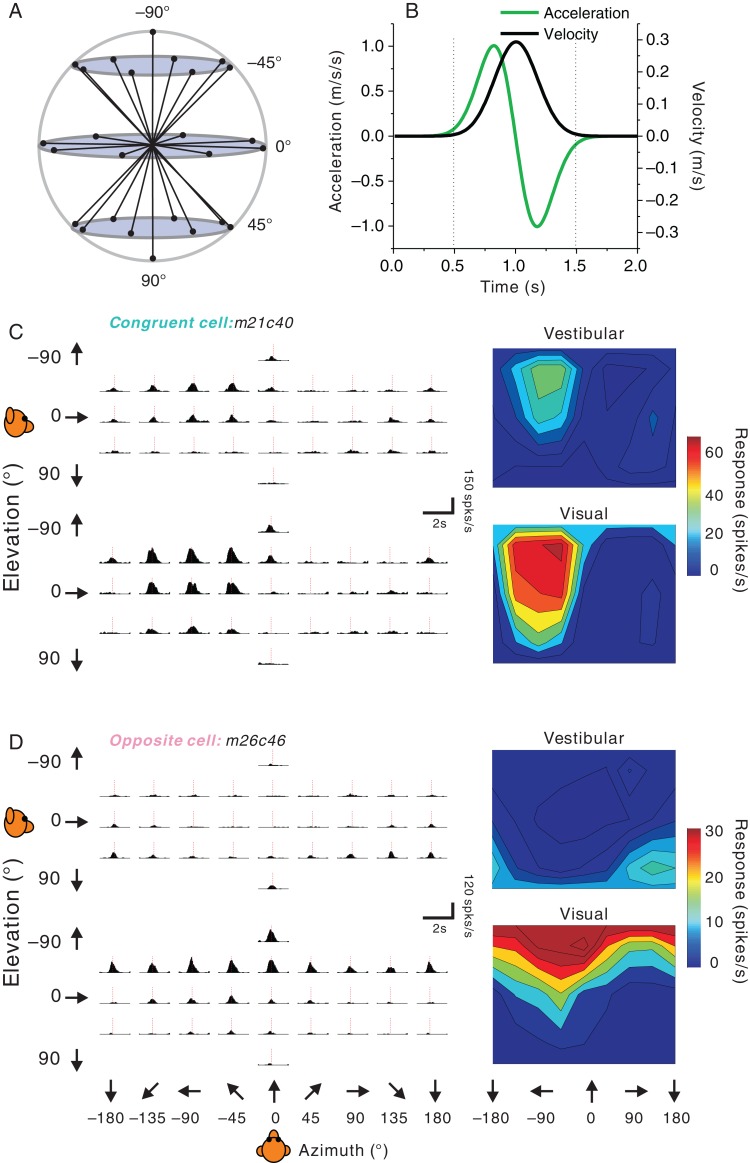
Figure 1.
Stimuli and examples of single-peaked 3D heading tuning. (A) Schematic of the 26 movement trajectories in 3D, spaced 45° apart in both azimuth and elevation. (B) The 2 s stimulus profile: velocity (black), acceleration (green). (C) Vestibular (top) and visual (bottom) PSTHs (left panels) and 3D heading tuning profiles (right panels) for a congruent FEFsem neuron. The dashed red vertical lines indicate the single peak time (vestibular: 925 ms, visual: 875 ms). (D) PSTHs and spatial tuning profiles for an FEFsem neuron with opposite heading preferences for the vestibular and visual conditions. For both example neurons, 3D tuning profiles are illustrated as color contour maps (Lambert cylindrical equal area projection of spherical data). Firing rate is based on spikes counted during the middle 1 s of the stimulus period. Dashed red vertical lines indicate the single peak times (vestibular: 1000 ms, visual: 900 ms).

