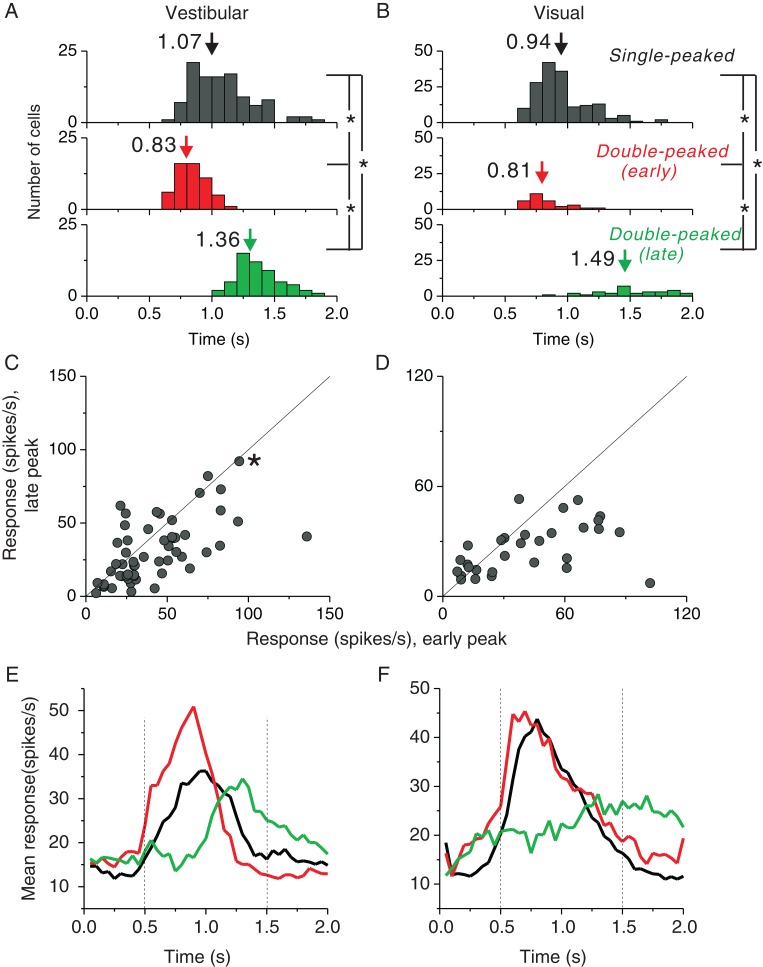
Figure 3.
Comparison of temporal response properties of single-peaked and double-peaked neurons. (A and B) Distributions of peak times for the vestibular and visual conditions, respectively. Top panels: peak times for single-peaked cells; middle panels: early peak times for double-peaked cells; bottom panels: late peak times for double-peaked cells. Arrows denote mean values. (C and D) Comparison of the response strength (averaged within a window of ±200 ms around each peak time) at the early peak versus late peak times for double-peaked cells in the vestibular (n = 55) and visual (n = 30) conditions, respectively. Solid lines show unity slope diagonals. The asterisk in C represents the example cell shown in Figure 2A and B, which is double-peaked only in the vestibular condition. (E and F) Population PSTHs for single-peaked and double-peaked cells in the vestibular (single-peaked cells: n = 106; double-peaked cells: n = 55) and visual (single-peaked cells: n = 164; double-peaked cells: n = 30) conditions, respectively. Black curves: single-peaked cells; red curves: double-peaked cells, with the maximum firing direction defined by PSTHs at the early peak time; green curves: double-peaked cells, with the maximum firing direction defined by PSTHs at the late peak time. Vertical dotted lines illustrate the middle 1s period used for computing firing rates (spike counts) in the main analyses.

