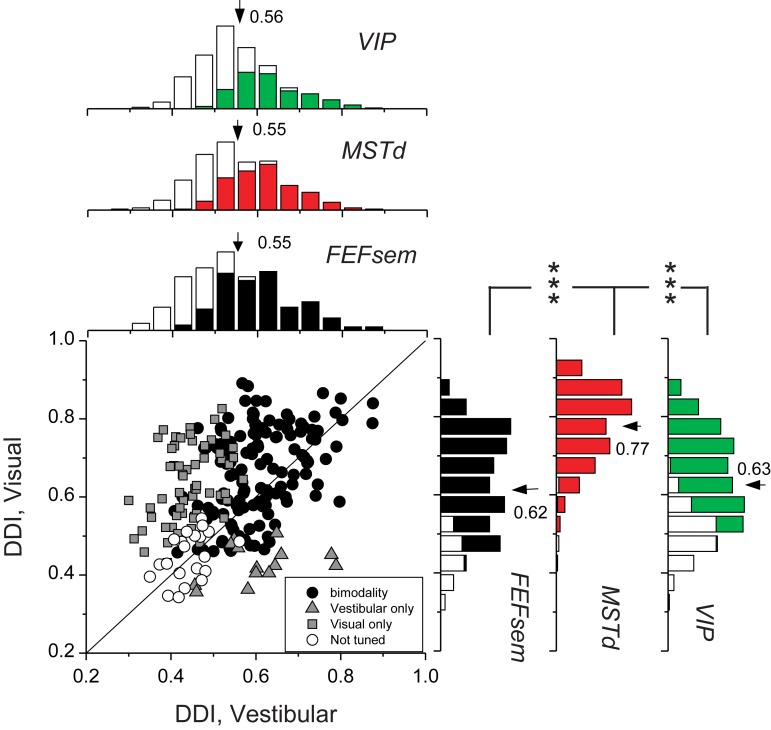
Figure 4.
Summary of heading selectivity. Selectivity was assessed by computing a DDI for the vestibular and visual conditions. Filled circles (n = 134) represent cells with significant vestibular and visual tuning (P < 0.05, 1-way ANOVA); gray squares (n = 60) indicate cells with significant visual tuning only; gray triangles (n = 14) represent cells with significant vestibular tuning only; open circles (n = 21) denote cells without significant tuning for both stimulus conditions. Solid line shows the unity slope diagonal. Marginal distributions of DDI for FEFsem (black) are compared with those for areas MSTd (red, n = 286) and VIP (green, n = 443). Filled bars: significant modulation to heading stimuli (P < 0.05, 1-way ANOVA); Open bars: insignificant modulation to heading stimuli (P > 0.05, 1-way ANOVA). Arrows, mean DDI values. Brackets with *** illustrate significant differences between areas (P < 0.001, t-test). In the absence of brackets, the mean DDI was not significantly different between each pair of areas (P > 0.05).

